Unlock a world of possibilities! Login now and discover the exclusive benefits awaiting you.
- Qlik Community
- :
- All Forums
- :
- QlikView App Dev
- :
- Re: Set Analysis Previous Months Data on the basis...
- Subscribe to RSS Feed
- Mark Topic as New
- Mark Topic as Read
- Float this Topic for Current User
- Bookmark
- Subscribe
- Mute
- Printer Friendly Page
- Mark as New
- Bookmark
- Subscribe
- Mute
- Subscribe to RSS Feed
- Permalink
- Report Inappropriate Content
Set Analysis Previous Months Data on the basis of Current Selected Month
Dear All,
I am just a novice user of Qlikview. I am attaching both sample excel file and sample qlikview document for my query.
My Query : I have the data as given in the Excel file.
Now I want to make a bar chart showing production for the currently selected month as well as say three or four previous months. Suppose currently selected month is May so I want data for Apr which falls in the same year which is selected. Now I want for say Mar which falls in previous year since my financial year starts from Apr every year. Data for Apr is no issue.
But I want dynamic set analysis expressions for previous months data falling in financial year which is not selected one. I would also like to avoid creating variables to store month names or previous years. I just want the data on the basis of currently selected month and year.
I have one period as Mon-Y which is in the format of DD-MM-YYYY in addition to Month name as May. so both Month and Mon-Y can be used in set analysis expressions. The Chart which I am making is there in the sheet.
Any guidance from you all will be of great help to me.
Regards,
Manish Prasad
- « Previous Replies
-
- 1
- 2
- Next Replies »
Accepted Solutions
- Mark as New
- Bookmark
- Subscribe
- Mute
- Subscribe to RSS Feed
- Permalink
- Report Inappropriate Content
Try Exp:
Sum({<FY, Month,[Mon-Y]={">$(=Num(Addmonths(Max([Mon-Y]),-vInputRolling))) <=$(=Max([Mon-Y]))"}>}Actual_Qty)

- Mark as New
- Bookmark
- Subscribe
- Mute
- Subscribe to RSS Feed
- Permalink
- Report Inappropriate Content
First of all, I would suggest you to Remove Logo of client, That's not good and we have to proactive. And then coming to your issue
Let's assume, If you click on 2018 and May then How you want to look in Bar chart?
- Mark as New
- Bookmark
- Subscribe
- Mute
- Subscribe to RSS Feed
- Permalink
- Report Inappropriate Content
I am clicking on May and 2018. Now I want in my bar chart last expression as production of May for year 2018 and previous expressions as Apr production falling in same year 2018, Mar production falling in year 2017, Feb production falling in year 2017 and so on up to which it is desired. For example say Feb, Mar, Apr and May which is the selected month. If I define variables then it can be easily done but I want to avoid that. Another problem is that I want Mar data without referencing to Year which is changing.
Hope I am able to clarify my question further.
Regards,
Manish Prasad
- Mark as New
- Bookmark
- Subscribe
- Mute
- Subscribe to RSS Feed
- Permalink
- Report Inappropriate Content
Like this?

Expression (for rolling 4):
Sum({<FY, Month,[Mon-Y]={">$(=Num(Addmonths(Max([Mon-Y]),-4))) <=$(=Max([Mon-Y]))"}>}Actual_Qty)
- Mark as New
- Bookmark
- Subscribe
- Mute
- Subscribe to RSS Feed
- Permalink
- Report Inappropriate Content
Dear Tresesco,
Your expression is exactly what I wanted. Have done some modifications to fulfill my requirements. I am satisfied with the results.
One modification which I wants now is that where you have written 4 to calculate last 4 months, I want to dynamically define that number of months on the basis of input box where user will select from drop down list as to how many months data he wants to see. say last 11 months or 10 months.
Can you guide me on this.
Regards
Manish Prasad
- Mark as New
- Bookmark
- Subscribe
- Mute
- Subscribe to RSS Feed
- Permalink
- Report Inappropriate Content
Try Exp:
Sum({<FY, Month,[Mon-Y]={">$(=Num(Addmonths(Max([Mon-Y]),-vInputRolling))) <=$(=Max([Mon-Y]))"}>}Actual_Qty)
- Mark as New
- Bookmark
- Subscribe
- Mute
- Subscribe to RSS Feed
- Permalink
- Report Inappropriate Content
Dear Tresesco,
Thanks for your guidance. This was what I exactly wanted. Now I will be able to do more Rolling Months Charts for other expressions.
Regards,
Manish Prasad
- Mark as New
- Bookmark
- Subscribe
- Mute
- Subscribe to RSS Feed
- Permalink
- Report Inappropriate Content
Dear Tresesco,
I have one more query in connection with same which you answered before.
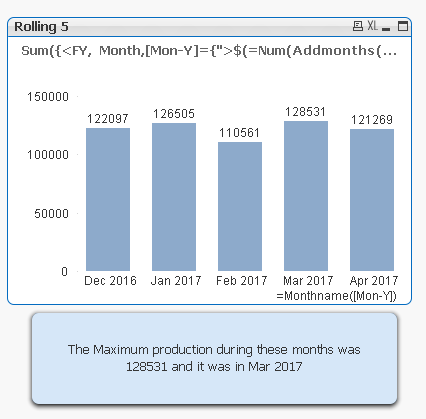
I want to create a text box object and show therein the maximum production Qty and in which month it was. It will be based on the chart which I made before.
For Example the text may be : "The Maximum production during these months was ......... and it was in ......."
Any guidance will be of great help to me.
- Mark as New
- Bookmark
- Subscribe
- Mute
- Subscribe to RSS Feed
- Permalink
- Report Inappropriate Content
Create two variables like:
vMaxDataInTheRange
=Max({1}Aggr(Sum({<FY, Month,[Mon-Y]={">$(=Num(Addmonths(Max([Mon-Y]),-vInputRolling))) <=$(=Max([Mon-Y]))"}>}Actual_Qty), [Mon-Y]))
vMaxDataMonth
=MonthName(FirstSortedValue( {1} [Mon-Y],-Aggr(Sum({<FY, Month,[Mon-Y]={">$(=Num(Addmonths(Max([Mon-Y]),-vInputRolling))) <=$(=Max([Mon-Y]))"}>}Actual_Qty), [Mon-Y])))
And then try text box expression =
'The Maximum production during these months was '& vMaxDataInTheRange &' and it was in '& vMaxDataMonth
- Mark as New
- Bookmark
- Subscribe
- Mute
- Subscribe to RSS Feed
- Permalink
- Report Inappropriate Content
Dear Tresesco,
Thanks for the guidance. It is working perfectly. Your guidance has helped me very much.
Regards,
Manish Prasad
- « Previous Replies
-
- 1
- 2
- Next Replies »