Unlock a world of possibilities! Login now and discover the exclusive benefits awaiting you.
- Qlik Community
- :
- All Forums
- :
- QlikView App Dev
- :
- Set Analysis Problem
- Subscribe to RSS Feed
- Mark Topic as New
- Mark Topic as Read
- Float this Topic for Current User
- Bookmark
- Subscribe
- Mute
- Printer Friendly Page
- Mark as New
- Bookmark
- Subscribe
- Mute
- Subscribe to RSS Feed
- Permalink
- Report Inappropriate Content
Set Analysis Problem
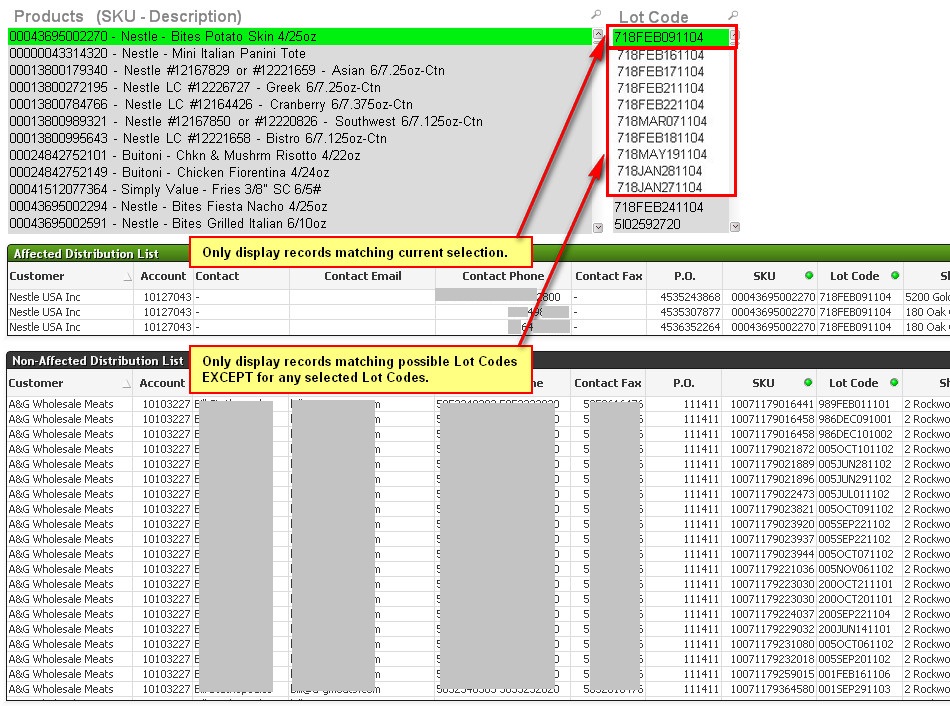
I'm trying to figure out how I can get one chart to reflect current selections (no problem) while another chart displays only possible selection minus the current selection.
This image should show what I'm after (the image doesn't show the expression columns where the Set Analysis would be inserted).

Accepted Solutions
- Mark as New
- Bookmark
- Subscribe
- Mute
- Subscribe to RSS Feed
- Permalink
- Report Inappropriate Content
Not quite, but you pointed me in the right direction. This worked:
sum({<[Lot Code]=E([Lot Code])>} Amount)
- Mark as New
- Bookmark
- Subscribe
- Mute
- Subscribe to RSS Feed
- Permalink
- Report Inappropriate Content
In your expresion for the second chart, that is not affected by the selection, include a expression like:
Sum({<LotCode=>} Amount)
- Mark as New
- Bookmark
- Subscribe
- Mute
- Subscribe to RSS Feed
- Permalink
- Report Inappropriate Content
I tried that but the selected Lot Code (in Green) is still in the 2nd chart. I only want the ones in white (associated values).
- Mark as New
- Bookmark
- Subscribe
- Mute
- Subscribe to RSS Feed
- Permalink
- Report Inappropriate Content
Ok... this is the possible values, you have to use
Sum({<LotCode = P(LotCode)>} Amount)
- Mark as New
- Bookmark
- Subscribe
- Mute
- Subscribe to RSS Feed
- Permalink
- Report Inappropriate Content
Not quite, but you pointed me in the right direction. This worked:
sum({<[Lot Code]=E([Lot Code])>} Amount)
- Mark as New
- Bookmark
- Subscribe
- Mute
- Subscribe to RSS Feed
- Permalink
- Report Inappropriate Content
Hi Brian,
Can you mark your own answer as correct, just makes it easier for the rest of us to find what we need
Thanks
neet solution BTW
Al