Unlock a world of possibilities! Login now and discover the exclusive benefits awaiting you.
- Qlik Community
- :
- All Forums
- :
- QlikView App Dev
- :
- Set Analysis on Timeseries Dimension
- Subscribe to RSS Feed
- Mark Topic as New
- Mark Topic as Read
- Float this Topic for Current User
- Bookmark
- Subscribe
- Mute
- Printer Friendly Page
- Mark as New
- Bookmark
- Subscribe
- Mute
- Subscribe to RSS Feed
- Permalink
- Report Inappropriate Content
Set Analysis on Timeseries Dimension
Hi there,
I want to create a line chart which shows 2 indices over time. The hard bit is that when i select a certain time period I want the chart only to show the change in that period. This would be calculated by taking the value - the value at the start of the period selected. I think this has to be done using set analysis and I have tried the following formula:
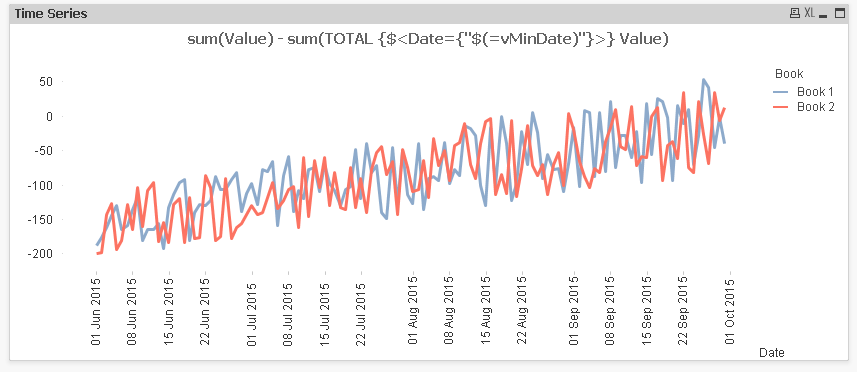
sum(Value) - sum({$<Date={'$vMinDate'}>} Value)
Where vMinDate is
=date(min(Date), 'DD MMM YYYY')
I have attached an example. My formula doesn't work.
Thanks
Max
Accepted Solutions
- Mark as New
- Bookmark
- Subscribe
- Mute
- Subscribe to RSS Feed
- Permalink
- Report Inappropriate Content
My bad, what about this?
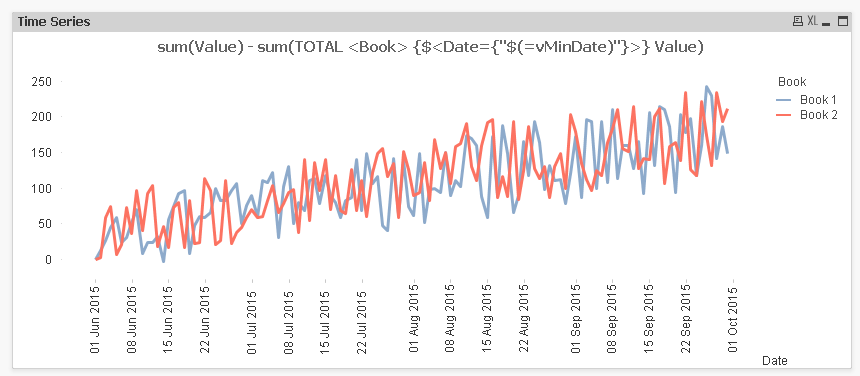
Sum(Value) - Sum(TOTAL <Book> {$<Date={"$(=vMinDate)"}>} Value)
- Mark as New
- Bookmark
- Subscribe
- Mute
- Subscribe to RSS Feed
- Permalink
- Report Inappropriate Content
Not sure what you want, but may be this?
sum(Value) - sum(TOTAL {$<Date={"$(=vMinDate)"}>} Value)
- Mark as New
- Bookmark
- Subscribe
- Mute
- Subscribe to RSS Feed
- Permalink
- Report Inappropriate Content
Hi Sunny T, thanks for the reply.
The idea is that for any time period selection both lines on the chart start from 0 and show the change just during the period selected. So that formula will not work unfortunately.
Thanks
- Mark as New
- Bookmark
- Subscribe
- Mute
- Subscribe to RSS Feed
- Permalink
- Report Inappropriate Content
My bad, what about this?
Sum(Value) - Sum(TOTAL <Book> {$<Date={"$(=vMinDate)"}>} Value)
- Mark as New
- Bookmark
- Subscribe
- Mute
- Subscribe to RSS Feed
- Permalink
- Report Inappropriate Content
That works perfect thanks for that. So the reason my previous formula didn't work is because I needed to total it by my second dimension?
- Mark as New
- Bookmark
- Subscribe
- Mute
- Subscribe to RSS Feed
- Permalink
- Report Inappropriate Content
I am not 100% sure if this is doing what you really intend to do. Currently, each data point is subtracted by the value on the selected date. If this is not what you want, please elaborate