Unlock a world of possibilities! Login now and discover the exclusive benefits awaiting you.
- Qlik Community
- :
- All Forums
- :
- QlikView App Dev
- :
- Set Analysis - sales in daily, weekly, monthly, ha...
- Subscribe to RSS Feed
- Mark Topic as New
- Mark Topic as Read
- Float this Topic for Current User
- Bookmark
- Subscribe
- Mute
- Printer Friendly Page
- Mark as New
- Bookmark
- Subscribe
- Mute
- Subscribe to RSS Feed
- Permalink
- Report Inappropriate Content
Set Analysis - sales in daily, weekly, monthly, half year and yearly
Hello all,
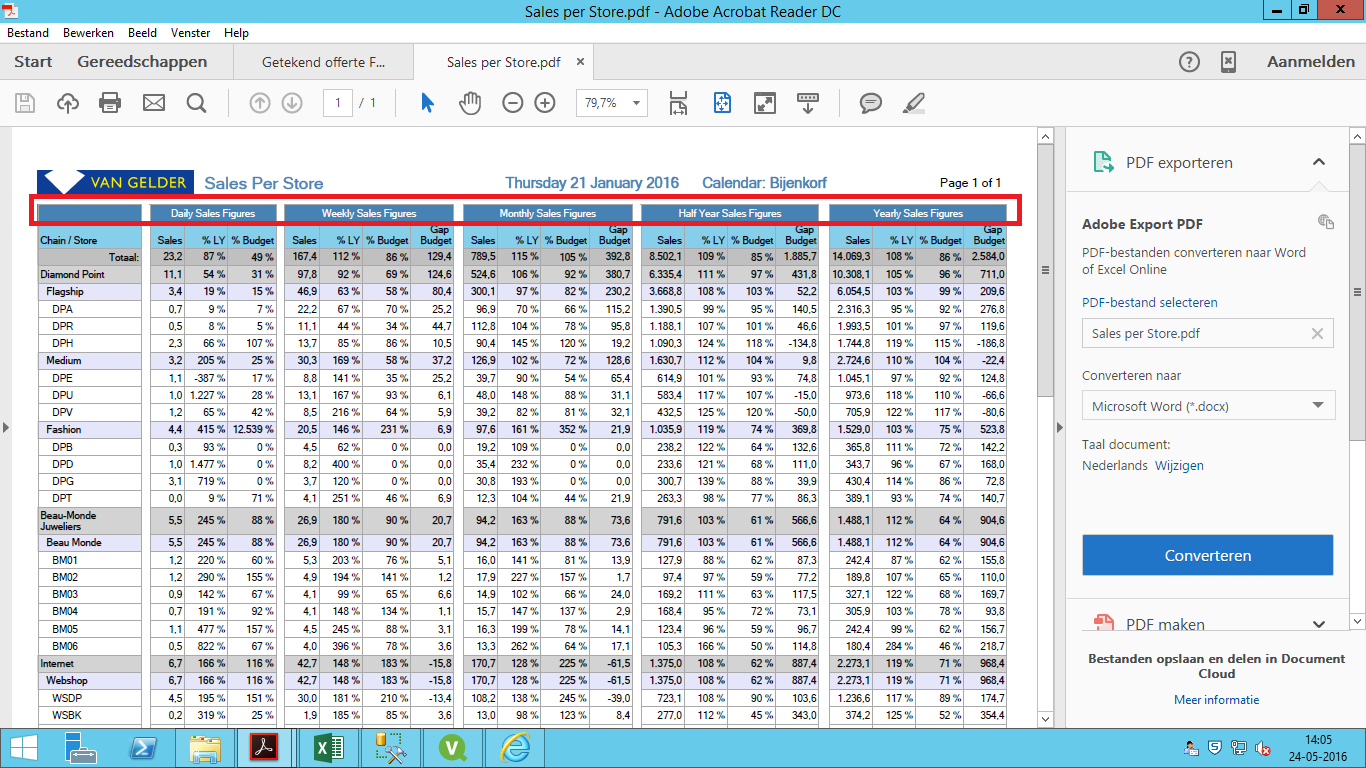
I want to create the below image report in my qlikview application.
the expressions are:
Sales = sum({$<Year={$(=Only(Year))}>}TransactionQuantity*SalesPrice)
%LY = sum ({$<Year={$(=Only(Year)-1)}>}TransactionQuantity*SalesPrice)
&Budget = sum(SalesPrice*TransactionQuantity)/ sum(Budget)
Gap Budget = sum(SalesPrice*TransactionQuantity) - sum(Budget)
how can i based, on these expressions, create a daily sales, weekly, monthly, half year and yearly sales figures (see red markered zone on the image below)
thank you so much!
Greets,
Rega

- Mark as New
- Bookmark
- Subscribe
- Mute
- Subscribe to RSS Feed
- Permalink
- Report Inappropriate Content
Try below like
Daily :
Sales = sum({$<Date={$(=max(Date))}>}TransactionQuantity*SalesPrice)
%LD = sum ({$<Date={$(=max(Date)-1)}>}TransactionQuantity*SalesPrice)
Weekly :
Sales = sum({$<Date={'>=$(=Weekstart(max(Date)))'}>}TransactionQuantity*SalesPrice)
%LD = sum ({$<Date={'>=$(=Weekstart(max(Date)-14)) <= >=$(=Weekend(max(Date)-14))'}>}TransactionQuantity*SalesPrice)
Monthly:
Sales = sum({$<Month={'$(=max(Month))'},Year={'$(=max(Year))'}>}TransactionQuantity*SalesPrice)
%LD = sum ({$<Date={'$(=max(Month)-1)},Year={'$(=max(Year))'}>}TransactionQuantity*SalesPrice)
- Mark as New
- Bookmark
- Subscribe
- Mute
- Subscribe to RSS Feed
- Permalink
- Report Inappropriate Content
When you are talking about e.g. Weekly, you mean something like Week-To-Date for this year and last year?
I've learned a lot from this series of blog posts when it came to point in time reporting:
The Magic of Set Analysis - Point In Time Reporting • Blog • AfterSync
- Mark as New
- Bookmark
- Subscribe
- Mute
- Subscribe to RSS Feed
- Permalink
- Report Inappropriate Content
hello Perumal,
none of your expressions don't works ![]() .
.
Would you be so kind to check my application? please see the tab called TEST.
Thank you so much!
Greets,
Perumal