Unlock a world of possibilities! Login now and discover the exclusive benefits awaiting you.
- Qlik Community
- :
- All Forums
- :
- QlikView App Dev
- :
- Re: Set Analysis with subfield and getfieldselecti...
- Subscribe to RSS Feed
- Mark Topic as New
- Mark Topic as Read
- Float this Topic for Current User
- Bookmark
- Subscribe
- Mute
- Printer Friendly Page
- Mark as New
- Bookmark
- Subscribe
- Mute
- Subscribe to RSS Feed
- Permalink
- Report Inappropriate Content
Set Analysis with subfield and getfieldselections
Scenario: I would like to use a "Combo Chart" to show 'one selected FinYear' compared with 'another selected FinYear'. I would like the user to be able to choose which Financial Years to compare, therefore this will not always be a comparison of the previous year.
I have a listbox of the FinYear field which contains values such as '2012-13', '2013-14' and '2014-15'
My first expression (that doesn't work) is
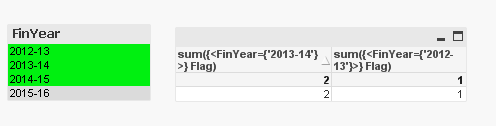
=sum({<FinYear={"$(=subfield(GetFieldSelections(FinYear),',',2))"}>}Flag) Display Options= Bar
and my second expression (also doesn't work) is
=sum({<FinYear={"$(=subfield(GetFieldSelections(FinYear),',',1))"}>}Flag) Display Options= Line
The user would then select two FinYears (for example '2012-13' and '2014-15') and the chart should show a bar for 2014-15 and a line for 2012-13. Instead the chart says "No data to display".
I have a text box with the following expression to test the values...
=GetFieldSelections(FinYear) & chr(10) &
SubField(GetFieldSelections(FinYear),',',2)& chr(10) &
SubField(GetFieldSelections(FinYear),',',1)
And this shows:
2012-13, 2014-15
2014-15
2012-13
Why do my chart expressions not work?
- Tags:
- new_to_qlikview
Accepted Solutions
- Mark as New
- Bookmark
- Subscribe
- Mute
- Subscribe to RSS Feed
- Permalink
- Report Inappropriate Content
I also think you can use max and min of FinYear instead of subfield......
something as
sum({<FinYear={'$(=minstring(FinYear))'}>} Flag)
- Mark as New
- Bookmark
- Subscribe
- Mute
- Subscribe to RSS Feed
- Permalink
- Report Inappropriate Content
Try this
=sum({<FinYear={"$(=subfield(concat(GetFieldSelections(FinYear),','),',',2))"}>}Flag)
=sum({<FinYear={"$(=subfield(concat(GetFieldSelections(FinYear),','),',',1))"}>}Flag)
- Mark as New
- Bookmark
- Subscribe
- Mute
- Subscribe to RSS Feed
- Permalink
- Report Inappropriate Content
Hi,
Try like this may be it will work
your first expression
=sum({<FinYear={"$(=subfield(GetFieldSelections(max(FinYear)),',',2))"}>}Flag)
Display Options for Bar
and your second expression is
=sum({<FinYear={"$(=subfield(GetFieldSelections(max(FinYear)),',',1))"}>}Flag)
Display Options for Line
- Mark as New
- Bookmark
- Subscribe
- Mute
- Subscribe to RSS Feed
- Permalink
- Report Inappropriate Content
Thank you for your reply Karthigayan C but this did not work.
I took your expression out of the dollar expansion bit and put it into a textbox =subfield(concat(GetFieldSelections(FinYear),','),',',2) and this correctly showed 2014-15 so I don't know why your expression did not work. The only thing that I can think of is, on one occasion when I was trying out various options the text box showed 1999 - ie it had evaluated the 2014-15 as an expression - 2014 minus 15. If that is what's going on in the chart how do I stop it from evaluating the expression?
- Mark as New
- Bookmark
- Subscribe
- Mute
- Subscribe to RSS Feed
- Permalink
- Report Inappropriate Content
Thank you for your reply rakesh goud but it did not work. I tried your expression in a text box (ie the dollar expansion bit) and the text box showed "Error: Error in expression: Nested aggregation not allowed"
- Mark as New
- Bookmark
- Subscribe
- Mute
- Subscribe to RSS Feed
- Permalink
- Report Inappropriate Content
some little changes
sum({<FinYear={'$(=trim(subfield(GetFieldSelections(FinYear),',',2)))'}>} Flag)
- Mark as New
- Bookmark
- Subscribe
- Mute
- Subscribe to RSS Feed
- Permalink
- Report Inappropriate Content
I also think you can use max and min of FinYear instead of subfield......
something as
sum({<FinYear={'$(=minstring(FinYear))'}>} Flag)
- Mark as New
- Bookmark
- Subscribe
- Mute
- Subscribe to RSS Feed
- Permalink
- Report Inappropriate Content
Brilliant! Thanks Massimo Grossi, it worked 
Of course! There's a space in the GetFieldSelections results, I'm thinking it's "2014-15" when
actually it's " 2014-15". Pretty obvious when I look at it now.
Whilst using the TRIM function definitely works I think I prefer your suggestion of MinString and
MaxString as these are shorter to use than the trim, subfield, getfieldselections combination.
Thanks again for your help.