Unlock a world of possibilities! Login now and discover the exclusive benefits awaiting you.
- Qlik Community
- :
- All Forums
- :
- QlikView App Dev
- :
- Re: Set analysis Expression
- Subscribe to RSS Feed
- Mark Topic as New
- Mark Topic as Read
- Float this Topic for Current User
- Bookmark
- Subscribe
- Mute
- Printer Friendly Page
- Mark as New
- Bookmark
- Subscribe
- Mute
- Subscribe to RSS Feed
- Permalink
- Report Inappropriate Content
Set analysis Expression
Hi All,
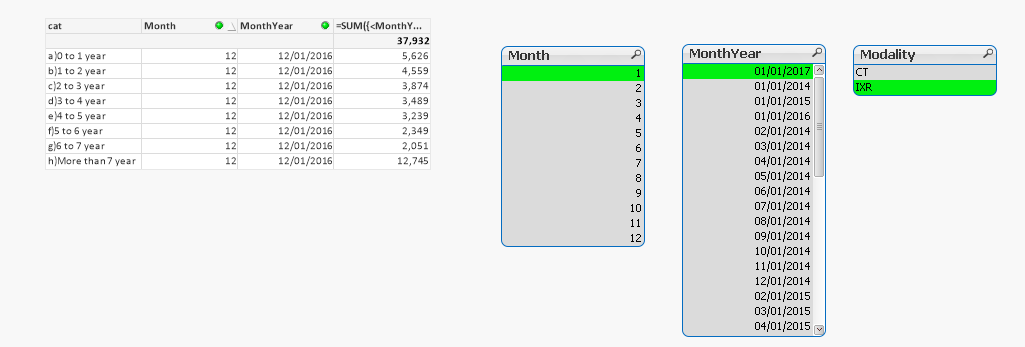
I have one straight table chart and i have written this set analysis expression.
The problem is the expression is not working it is still showing 2017 values but it should show 2016 december values.
The expression is:
=SUM({<MonthYear={">=$(=Date(AddMonths(Max(MonthYear), -1)))<=$(=Date(Max(MonthYear)))"}>}IB)
Attached app for reference.
Thanks,
Bharat
- Mark as New
- Bookmark
- Subscribe
- Mute
- Subscribe to RSS Feed
- Permalink
- Report Inappropriate Content
Hi,
You have to exclude the selection of the Month Field from Expression.
try the below Expression.
=SUM({<MonthYear={">=$(=Date(AddMonths(Max(MonthYear), -1)))<=$(=Date(Max(MonthYear)))"},Month=>}IB)
if you want only previous Month then try below expression.
=SUM({<MonthYear={">=$(=Date(AddMonths(Max(MonthYear), -1)))<$(=Date(Max(MonthYear)))"},Month=>}IB)
Thanks,
Mukram
- Mark as New
- Bookmark
- Subscribe
- Mute
- Subscribe to RSS Feed
- Permalink
- Report Inappropriate Content
Hi Mukram,
Thanks for you reply. Pls find the attached app.
Here if i select Jan the data is not showing in the graph.. The expression is working fine and the values are correct but i want to see Jan in chart..
Pls let me know if you need anything more..
- Mark as New
- Bookmark
- Subscribe
- Mute
- Subscribe to RSS Feed
- Permalink
- Report Inappropriate Content
Hi Bharat,
find the attached App.
- Mark as New
- Bookmark
- Subscribe
- Mute
- Subscribe to RSS Feed
- Permalink
- Report Inappropriate Content
Hi Mukram,
Thanks for your time but the format i need is the below one:
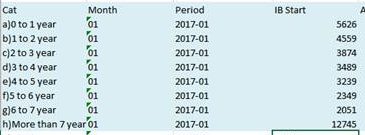
In your app we can see only December but the dimesions should be selected months for example say Jan. .I need to see jan dimesion but the expression should always show only december values.
Please let me know if you need anything more..
- Mark as New
- Bookmark
- Subscribe
- Mute
- Subscribe to RSS Feed
- Permalink
- Report Inappropriate Content
HI Bharat,
In the Set Analysis, we are applying the condition on Month also so if you select Jan from Month it will show you Dec in the chart,
maybe you can try to create a new field in the script like what I did in the attached application,
- Mark as New
- Bookmark
- Subscribe
- Mute
- Subscribe to RSS Feed
- Permalink
- Report Inappropriate Content
May be this
=Sum({<MonthYear={">=$(=Date(AddMonths(Max(MonthYear), -1)))<$(=Date(Max(MonthYear)))"}, Month>}IB)