Unlock a world of possibilities! Login now and discover the exclusive benefits awaiting you.
- Qlik Community
- :
- All Forums
- :
- QlikView App Dev
- :
- Set analysis - Help
- Subscribe to RSS Feed
- Mark Topic as New
- Mark Topic as Read
- Float this Topic for Current User
- Bookmark
- Subscribe
- Mute
- Printer Friendly Page
- Mark as New
- Bookmark
- Subscribe
- Mute
- Subscribe to RSS Feed
- Permalink
- Report Inappropriate Content
Set analysis - Help
Hi Gurus,
I have below scenario.
Data that I have is for 9 Quarters (Q1'17 till Q1'19).
I want to plot a pivot chart which can accommodate 3 Blocks ,
1st block is the sum of Quarterly Metric Values
2nd block is the difference between same Quarters of Latest 2 years (Ex: Q1'19 - Q1'18 Quarterly difference y/y)
3rd block is the Quarterly increase/decrease % ( Q1'19 - Q1'18 ) / Q1'18 - Quarter Trend y/y)
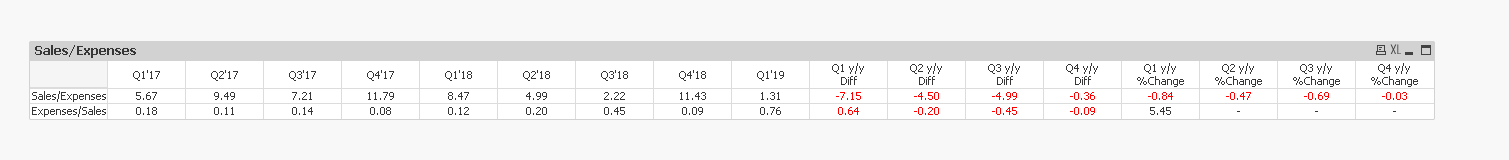
current Table Format from QV

Required Format

Help needed.
in the attached QV app, I am unable to accommodate Quarter condition so that while comparing Q2 y/y Diff, it will consider Q2'18 - Q1'17. But in the current model it is considering Q2'19 - Q2'18 causing negative Values as we do not have Q2'19 values in Data model.
so How do I modify the condition of Max Year in set analysis to accommodate Corresponding Quarter?
in straight dimension, it is easy, but Here the model has Picking 3 dimensions using Pick function. How do I accommodate Quarter comparison here?
Accepted Solutions
- Mark as New
- Bookmark
- Subscribe
- Mute
- Subscribe to RSS Feed
- Permalink
- Report Inappropriate Content
Did it for one of the expressions...
Expression
Pick(Dim,
Sum({<Metric ={'Sales'}>}Value)/Sum({<Metric ={'Expenses'}>}Value),
RangeSum(Sum({<Metric ={'Sales'}, FYearMonth = {"$(='>' & Date(AddYears(Max(FYearMonth), -1), 'YYYYMM') & '<=' & Date(AddYears(Max(FYearMonth), 0), 'YYYYMM'))"}>}Value)/Sum({<Metric ={'Expenses'}, FYearMonth = {"$(='>' & Date(AddYears(Max(FYearMonth), -1), 'YYYYMM') & '<=' & Date(AddYears(Max(FYearMonth), 0), 'YYYYMM'))"}>}Value), -
Sum({<Metric ={'Sales'}, FYearMonth = {"$(='>' & Date(AddYears(Max(FYearMonth), -2), 'YYYYMM') & '<=' & Date(AddYears(Max(FYearMonth), -1), 'YYYYMM'))"}>}Value)/Sum({<Metric ={'Expenses'}, FYearMonth = {"$(='>' & Date(AddYears(Max(FYearMonth), -2), 'YYYYMM') & '<=' & Date(AddYears(Max(FYearMonth), -1), 'YYYYMM'))"}>}Value)),
(Sum({<Metric ={'Sales'}, FYearMonth = {"$(='>' & Date(AddYears(Max(FYearMonth), -1), 'YYYYMM') & '<=' & Date(AddYears(Max(FYearMonth), 0), 'YYYYMM'))"}>}Value)/Sum({<Metric ={'Expenses'}, FYearMonth = {"$(='>' & Date(AddYears(Max(FYearMonth), -1), 'YYYYMM') & '<=' & Date(AddYears(Max(FYearMonth), 0), 'YYYYMM'))"}>}Value))/
(Sum({<Metric ={'Sales'}, FYearMonth = {"$(='>' & Date(AddYears(Max(FYearMonth), -2), 'YYYYMM') & '<=' & Date(AddYears(Max(FYearMonth), -1), 'YYYYMM'))"}>}Value)/Sum({<Metric ={'Expenses'}, FYearMonth = {"$(='>' & Date(AddYears(Max(FYearMonth), -2), 'YYYYMM') & '<=' & Date(AddYears(Max(FYearMonth), -1), 'YYYYMM'))"}>}Value))-1)
Where FYearMonth looks like this in the script
Date(MonthStart(Date#(('20' & Right(Fiscal_Quarter, 2)*100)+Mid(Fiscal_Quarter, 2, 1)*3, 'YYYYMM')), 'YYYYMM') as FYearMonth,