Unlock a world of possibilities! Login now and discover the exclusive benefits awaiting you.
- Qlik Community
- :
- All Forums
- :
- QlikView App Dev
- :
- Re: Set analysis and selection
- Subscribe to RSS Feed
- Mark Topic as New
- Mark Topic as Read
- Float this Topic for Current User
- Bookmark
- Subscribe
- Mute
- Printer Friendly Page
- Mark as New
- Bookmark
- Subscribe
- Mute
- Subscribe to RSS Feed
- Permalink
- Report Inappropriate Content
Set analysis and selection
Hello Everyone,
I have a chart in my QlikView application in which I am using set analysis in expressions to calculate the values based on set analysis conditions. One of the expressions is as follows:
Freight-out= sum({$<F1={"Freight-out"}>}Data)/sum({$<F1={"Net sales without tooling"}>}Data)
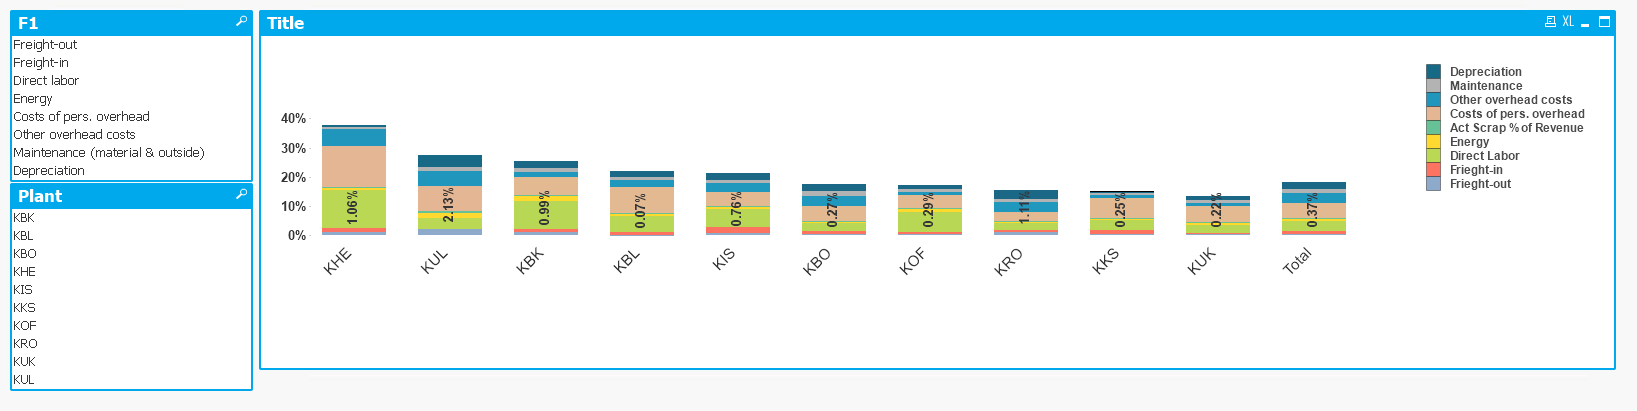
Similarly there are 8 other expressions in the stacked bar chart as shown in the below screenshot.
Field F1 here contains values, "Freight-out", "Freight-in", "Direct Labor", "Energy", "Act Scrap % of Revenue", "Costs of pers. overhead", "Other Overhead Costs", "Maintenance", "Depreciation" and "Net sales without tooling". User wants a stacked bar graph which displays Freight-out as Freight out value divided by Net sales without tooling value, Freight-in as Freight-in value divided by Net sales without tooling value and so on... To arrive at these calculations I have written the expression as shown above for Freight-out above. Similar expression applies for other F1 values as well. Now the problem is user wants to see only Freight-out data for all plants when he selects "Freight-out" in field F1. Similarly he would like to see only Freight-in data for all plants when he selects "Freight-in" in field F1 and so on...Since I have applied condition on field, F1 using set analysis, any selection made in this field isn't affecting the graph. Is it possible to do so in QlikView?
Any help on this?
Thank you.
Accepted Solutions
- Mark as New
- Bookmark
- Subscribe
- Mute
- Subscribe to RSS Feed
- Permalink
- Report Inappropriate Content
I guess, you need to use conditional enablement of the expression, and use expression like:
=MinString(F1='Freight-out')
I have shown for first two expressions in sample app, rest you can.
- Mark as New
- Bookmark
- Subscribe
- Mute
- Subscribe to RSS Feed
- Permalink
- Report Inappropriate Content
Not sure if I understood right. Implicit Set Operators (perhaps '*') might be what you need.
- Mark as New
- Bookmark
- Subscribe
- Mute
- Subscribe to RSS Feed
- Permalink
- Report Inappropriate Content
Hi Tresesco,
Thanks for your response. I will go through it!
Here is what I want, in case the above explanation was not so clear!
When I select value, "Freight-out" in field F1, the graph should display only Freight-out data for all plants. Similarly, if I select, "Freight-in", graph should display only Freight-in data for all plants and so on. Something like below!

Thank you.
- Mark as New
- Bookmark
- Subscribe
- Mute
- Subscribe to RSS Feed
- Permalink
- Report Inappropriate Content
Could you also attach your sample qvw?
- Mark as New
- Bookmark
- Subscribe
- Mute
- Subscribe to RSS Feed
- Permalink
- Report Inappropriate Content
PFA the application! This application contains data only for two plants.
Thank you.
- Mark as New
- Bookmark
- Subscribe
- Mute
- Subscribe to RSS Feed
- Permalink
- Report Inappropriate Content
I guess, you need to use conditional enablement of the expression, and use expression like:
=MinString(F1='Freight-out')
I have shown for first two expressions in sample app, rest you can.
- Mark as New
- Bookmark
- Subscribe
- Mute
- Subscribe to RSS Feed
- Permalink
- Report Inappropriate Content
Hi Tresesco,
Great! That works as expected. Thanks a lot!