Unlock a world of possibilities! Login now and discover the exclusive benefits awaiting you.
- Qlik Community
- :
- All Forums
- :
- QlikView App Dev
- :
- Set analysis help
- Subscribe to RSS Feed
- Mark Topic as New
- Mark Topic as Read
- Float this Topic for Current User
- Bookmark
- Subscribe
- Mute
- Printer Friendly Page
- Mark as New
- Bookmark
- Subscribe
- Mute
- Subscribe to RSS Feed
- Permalink
- Report Inappropriate Content
Set analysis help
Hi ,
I would like to create a chart t where I can show just a specific statutes from a column.
tabel1:
id,
date,
stas as status
from test.qvd
concatenate
tabel2:
id,
date,
stat1 as status
from test.qvd
The status column has more 'statues' like (Approved, Implementation, Scheduled, Work In Progress,Analysis, Approval Requested, Assigned,Closed, Cleared, Completed, Withdrawn) .
I would like to group them by 3 categories like:
AAA( Approved, Implementation, Scheduled, Work In Progress)
BBB(Analysis, Approval Requested, )
CCC(Assigned,Closed, Cleared, Completed, Withdrawn)
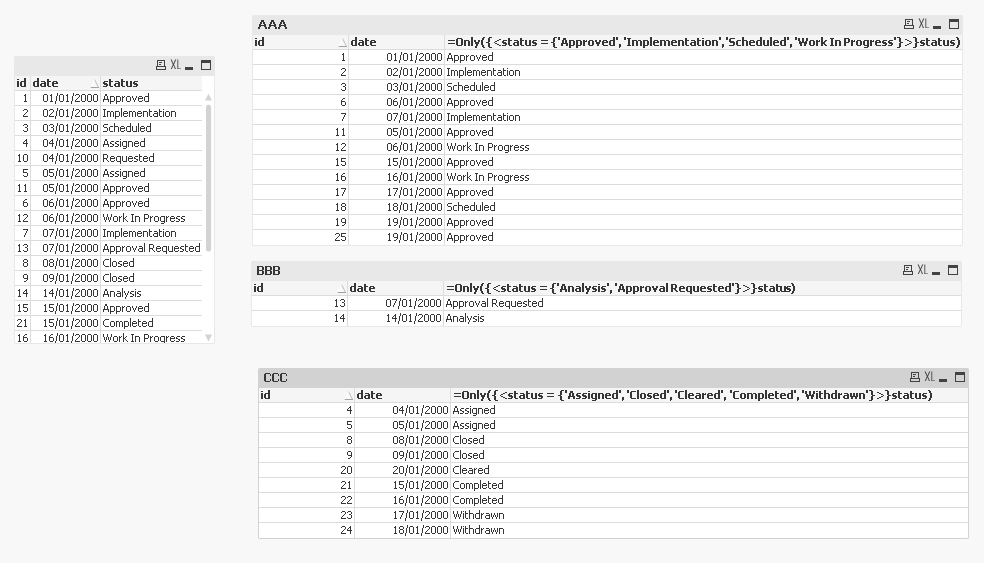
I want to group them in a chart to have something like this:
| Main Table | ||
| id | date | status |
| 1 | 01/01/2000 | Approved |
| 2 | 02/01/2000 | Implementation |
| 3 | 03/01/2000 | Scheduled |
| 4 | 04/01/2000 | Assigned |
| 5 | 05/01/2000 | Assigned |
| 6 | 06/01/2000 | Approved |
| 7 | 07/01/2000 | Implementation |
| 8 | 08/01/2000 | Closed |
| 9 | 09/01/2000 | Closed |
| 10 | 04/01/2000 | Requested |
| 11 | 05/01/2000 | Approved |
| 12 | 06/01/2000 | Work In Progress |
| 13 | 07/01/2000 | Approval Requested |
| 14 | 14/01/2000 | Analysis |
| 15 | 15/01/2000 | Approved |
| 16 | 16/01/2000 | Work In Progress |
| 17 | 17/01/2000 | Approved |
| 18 | 18/01/2000 | Scheduled |
| 19 | 19/01/2000 | Approved |
| 20 | 20/01/2000 | Cleared |
| 21 | 15/01/2000 | Completed |
| 22 | 16/01/2000 | Completed |
| 23 | 17/01/2000 | Withdrawn |
| 24 | 18/01/2000 | Withdrawn |
| 25 | 19/01/2000 | Approved |
| AAA | ||
| id | date | status |
| 1 | 01/01/2000 | Approved |
| 6 | 06/01/2000 | Approved |
| 11 | 05/01/2000 | Approved |
| 15 | 15/01/2000 | Approved |
| 17 | 17/01/2000 | Approved |
| 25 | 19/01/2000 | Approved |
| 2 | 02/01/2000 | Implementation |
| 7 | 07/01/2000 | Implementation |
| 3 | 03/01/2000 | Scheduled |
| 18 | 18/01/2000 | Scheduled |
| 12 | 06/01/2000 | Work In Progress |
| 16 | 16/01/2000 | Work In Progress |
| BBB | ||
| id | date | status |
| 14 | 14/01/2000 | Analysis |
| 13 | 07/01/2000 | Approval Requested |
| CCC | ||
| id | date | status |
| 4 | 04/01/2000 | Assigned |
| 5 | 05/01/2000 | Assigned |
| 8 | 08/01/2000 | Closed |
| 9 | 09/01/2000 | Closed |
| 20 | 20/01/2000 | Cleared |
| 21 | 15/01/2000 | Completed |
| 22 | 16/01/2000 | Completed |
| 23 | 17/01/2000 | Withdrawn |
| 24 | 18/01/2000 | Withdrawn |
Accepted Solutions
- Mark as New
- Bookmark
- Subscribe
- Mute
- Subscribe to RSS Feed
- Permalink
- Report Inappropriate Content
- Mark as New
- Bookmark
- Subscribe
- Mute
- Subscribe to RSS Feed
- Permalink
- Report Inappropriate Content
Like attached?
- Mark as New
- Bookmark
- Subscribe
- Mute
- Subscribe to RSS Feed
- Permalink
- Report Inappropriate Content
Try like this
tabel1:
id,
date,
stas as status,
if(stas= 'Approved' or stas='Implementation 'or stas='Scheduled' or stas='Work In Progress ',
'AAA',
if(stas= 'Analysis ' or stas= 'Approval Requested''=, 'BBB',
if(stas= 'Assigned'or stas= 'Closed' or stas= ' Cleared' or stas= 'Completed ' or stas= 'Withdrawn' ,'CCC',
stas
)
)
) as New_Stauts
from test.qvd
concatenate
tabel2:
id,
date,
stat1 as status,
if(stas= 'Approved' or stas='Implementation 'or stas='Scheduled' or stas='Work In Progress ',
'AAA',
if(stas= 'Analysis ' or stas= 'Approval Requested''=, 'BBB',
if(stas= 'Assigned'or stas= 'Closed' or stas= ' Cleared' or stas= 'Completed ' or stas= 'Withdrawn' ,'CCC',
stas
)
)
) as New_Stauts
from test.qvd
now in the front end
1.For AAA table
*add the dimensions
*Expression count({<New_Stauts={'AAA'}>}id)
similarly follow for other tables like BBB and CCC
- Mark as New
- Bookmark
- Subscribe
- Mute
- Subscribe to RSS Feed
- Permalink
- Report Inappropriate Content
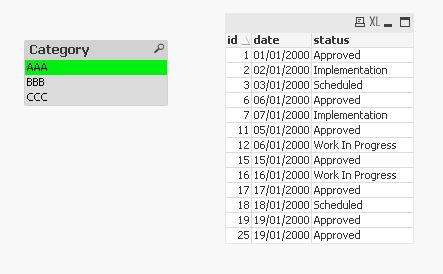
you can create the Category field in script like below, then you can use this Category field as selection
LOAD *,
if(match(status,'Approved', 'Implementation', 'Scheduled', 'Work In Progress'),'AAA',
if(match(status,'Analysis', 'Approval Requested'),'BBB',
if(match(status,'Assigned','Closed', 'Cleared', 'Completed', 'Withdrawn'),'CCC'))) as Category
- Mark as New
- Bookmark
- Subscribe
- Mute
- Subscribe to RSS Feed
- Permalink
- Report Inappropriate Content
Hi Constantin,
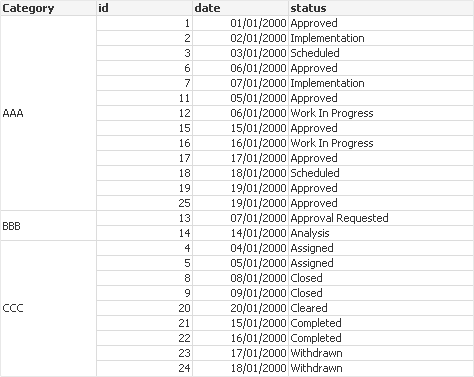
Calculated Dimension like this
=Pick(Match(status,'Approved', 'Implementation', 'Scheduled','Work In Progress'),'AAA','AAA','AAA','AAA')&
Pick(Match(status,'Analysis','Approval Requested'),'BBB','BBB')&
Pick(Match(status,'Assigned','Closed','Cleared','Completed','Withdrawn'),'CCC','CCC','CCC','CCC','CCC')
Regards,
Antonio
- Mark as New
- Bookmark
- Subscribe
- Mute
- Subscribe to RSS Feed
- Permalink
- Report Inappropriate Content
Thank you for your answer now all sorted.