Unlock a world of possibilities! Login now and discover the exclusive benefits awaiting you.
- Qlik Community
- :
- All Forums
- :
- QlikView App Dev
- :
- Set analysis with mutliple conditions
- Subscribe to RSS Feed
- Mark Topic as New
- Mark Topic as Read
- Float this Topic for Current User
- Bookmark
- Subscribe
- Mute
- Printer Friendly Page
- Mark as New
- Bookmark
- Subscribe
- Mute
- Subscribe to RSS Feed
- Permalink
- Report Inappropriate Content
Set analysis with mutliple conditions
Hi,
I am struggling to get the following set analysis to work.
Basically, I am trying to get the Sum(QuantityYTD) for Clients with Revenue Current Year >0 and Revenue Past Year =0.
Here is what I have:
SUM({$<[CIB Parent Name] = {"=sum(AmountYTD)>0 and sum(AmountPYTD)=0" }>}QuantityYTD)
In my QV model I have pivot chart with Service Level Group dimension and the above expression
The pivot chart displays incorrect values when no Service Level Group is selected. As soon as I select 1 Service Level Group value, the expression returns corrrect results.
Pulling my hair out. Your help/direction is much appreciated.
Thank you,
R
- Mark as New
- Bookmark
- Subscribe
- Mute
- Subscribe to RSS Feed
- Permalink
- Report Inappropriate Content
its wrong to use a condition like this ->sum(AmountYTD)>0 and sum(AmountPYTD)=0
try an if condition instead of set analysis
if(sum(AmountYTD)>0 and sum(AmountPYTD)=0,sum(QuantityYTD),0)
hth
Sasi
- Mark as New
- Bookmark
- Subscribe
- Mute
- Subscribe to RSS Feed
- Permalink
- Report Inappropriate Content
Hi Sasi,
Unfortunately, that approach wont work.
For Service Level Group dimension, I need to get only "New Business Volume" generated by Clients based on the rule I a described above. (Clients with Revenue Current Year >0 and Revenue Past Year =0)
If I were to apply what you suggested, I will get 0 for all Service Level Group values as AmountPYTD is always >0 at Service Level Group.
I need to use SET ANALYSIS to get New Business Volume for a given Service Level Group.
Thank you for your input thou.
R
- Mark as New
- Bookmark
- Subscribe
- Mute
- Subscribe to RSS Feed
- Permalink
- Report Inappropriate Content
May be this:
=Sum(If(Sum(AmountYTD) > 0 and Sum(AmountPYTD) = 0, QuantityYTD))
- Mark as New
- Bookmark
- Subscribe
- Mute
- Subscribe to RSS Feed
- Permalink
- Report Inappropriate Content
The problem appears to be the in the relationship the service level group and the table itself.
I think we need some more information about the pivot table (dimensions) and your data model structure (how is the service level group associated with the chart dimensions/expressions). it would also be useful to know what result you are getting and the result you require.
Of course, the best is to post your qvw or a representative sample.
- Mark as New
- Bookmark
- Subscribe
- Mute
- Subscribe to RSS Feed
- Permalink
- Report Inappropriate Content
Hi Jonanthan,
The below pictures shows a pivot chart (no rules or conditions or selections applied), simple pivot with 1 dimension (ServiceGroupOwner) and some measures.
Please do note the New Business-Amount and New Business-Volume amounts when NO SELECTION is made and when 1 ServiceGroupOwner value is selected. To restate, the New Business is looking for CLIENTS that have Revenue this year and had 0 revenue last year.
Please note the expressions for:
New Business-Amount: SUM({$<[CIB Parent Name] = {"=sum(AmountYTD)>0 and sum(AmountPYTD)=0" }>}AmountYTD)
New Business-Volume: SUM({$<[CIB Parent Name] = {"=sum(AmountYTD)>0 and sum(AmountPYTD)=0" }>}QuantityYTD)
I tried using AGGR over ServiceGroupOwner dimension but does not work either. Not sure where the disconnect is.
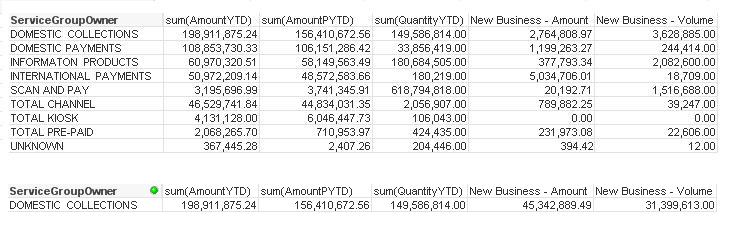
Do note that the amount 31,399,613 is the correct amount (this was done by extracting CIB Parent Name for Domestic Collections and comparing SUM(AmountYTD ), SUM(AmountPYTD, and SUM(QuantityYTD) )
Your help is much appreciated.
R
- Mark as New
- Bookmark
- Subscribe
- Mute
- Subscribe to RSS Feed
- Permalink
- Report Inappropriate Content
please post a sample application