Unlock a world of possibilities! Login now and discover the exclusive benefits awaiting you.
Woohoo! Qlik Community has won “Best in Class Community” in the 2024
Khoros Kudos awards!
Announcements
Nov. 20th, Qlik Insider - Lakehouses: Driving the Future of Data & AI - PICK A SESSION
- Qlik Community
- :
- All Forums
- :
- QlikView App Dev
- :
- Re: Show All Values of Bucket in Cross Tab
Options
- Subscribe to RSS Feed
- Mark Topic as New
- Mark Topic as Read
- Float this Topic for Current User
- Bookmark
- Subscribe
- Mute
- Printer Friendly Page
Turn on suggestions
Auto-suggest helps you quickly narrow down your search results by suggesting possible matches as you type.
Showing results for
Partner - Contributor III
2017-07-12
10:14 AM
- Mark as New
- Bookmark
- Subscribe
- Mute
- Subscribe to RSS Feed
- Permalink
- Report Inappropriate Content
Show All Values of Bucket in Cross Tab
Hi All,
I have created a bucket by comparing a measure value (measure1) with below logic and I am using this Bucket as a dimension in pivot table. Now the issue is i am getting only those buckets for which i have some value of measure. Is there a way i can show all values of buckets even if we dont have any measure value. Show All values is coming disabled in this case.
[Bucket Table]:
LOAD * INLINE [
Low,High,Value
0,10,0%-10%
10,20,20%
20,30,30%
30,40,40%
40,50,50%
50,60,60%
60,70,70%
70,80,80%
80,90,90%
90,100,100%
];
Let vLow1 = Peek('Low',0);
Let vLow2 = Peek('Low',1);
Let vLow3 = Peek('Low',2);
Let vLow4 = Peek('Low',3);
Let vLow5 = Peek('Low',4);
Let vLow6 = Peek('Low',5);
Let vLow7 = Peek('Low',6);
Let vLow8 = Peek('Low',7);
Let vLow9 = Peek('Low',8);
Let vLow10 = Peek('Low',9);
Let vHigh1 = Peek('High',0);
Let vHigh2 = Peek('High',1);
Let vHigh3 = Peek('High',2);
Let vHigh4 = Peek('High',3);
Let vHigh5 = Peek('High',4);
Let vHigh6 = Peek('High',5);
Let vHigh7 = Peek('High',6);
Let vHigh8 = Peek('High',7);
Let vHigh9 = Peek('High',8);
Let vHigh10 = Peek('High',9);
Let vBucket1 = Peek('Value',0);
Let vBucket2 = Peek('Value',1);
Let vBucket3 = Peek('Value',2);
Let vBucket4 = Peek('Value',3);
Let vBucket5 = Peek('Value',4);
Let vBucket6 = Peek('Value',5);
Let vBucket7 = Peek('Value',6);
Let vBucket8 = Peek('Value',7);
Let vBucket9 = Peek('Value',8);
Let vBucket10 = Peek('Value',9);
Chart Bucket Formula:
if(Measure1>vLow1 and Measure1<=vHigh1, vBucket1,
if(Measure1>vLow2 and Measure1<=vHigh2, vBucket2,
if(Measure1>vLow3 and Measure1<=vHigh3, vBucket3,
if(Measure1>vLow4 and Measure1<=vHigh4, vBucket4,
if(Measure1>vLow5 and Measure1<=vHigh5, vBucket5,
if(Measure1>vLow6 and Measure1<=vHigh6, vBucket6,
if(Measure1>vLow7 and Measure1<=vHigh7, vBucket7,
if(Measure1>vLow8 and Measure1<=vHigh8, vBucket8,
if(Measure1>vLow9 and Measure1<=vHigh9, vBucket9,
vBucket10
)))))))))
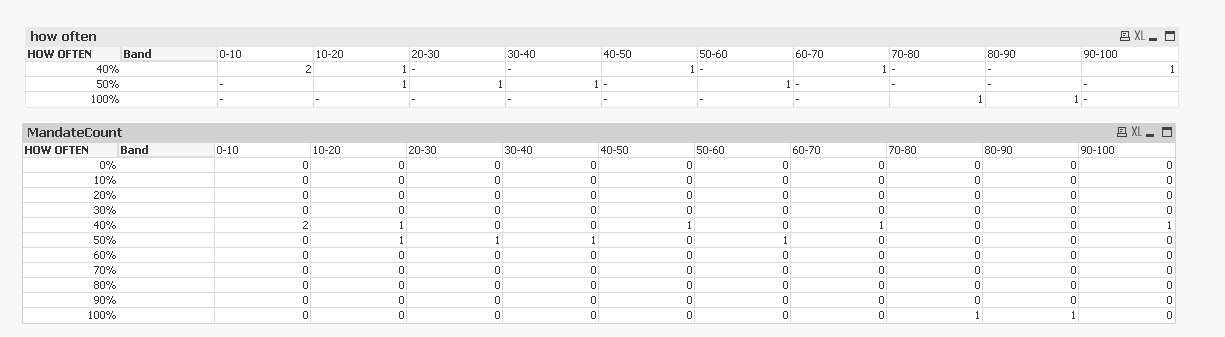
Field " How Often" is in question here..
Present Scenario:

Expected Scenario:
| HOW OFTEN | Band | 0-10 | 20-Oct | 20-30 | 30-40 | 40-50 | 50-60 | 60-70 | 70-80 | 80-90 | 90-100 |
| 0-10% | |||||||||||
| 20% | |||||||||||
| 30% | |||||||||||
| 40% | 2 | 1 | - | - | 1 | - | 1 | - | - | 1 | |
| 50% | - | 1 | 1 | 1 | - | 1 | - | - | - | - | |
| 60% | |||||||||||
| 70% | |||||||||||
| 80% | |||||||||||
| 90% | |||||||||||
| 100% | - | - | - | - | - | - | - | 1 | 1 | - |
- « Previous Replies
-
- 1
- 2
- Next Replies »
1 Solution
Accepted Solutions
MVP
2017-07-12
01:36 PM
- Mark as New
- Bookmark
- Subscribe
- Mute
- Subscribe to RSS Feed
- Permalink
- Report Inappropriate Content
Add a new table like this
LOAD * INLINE [
Bucket_Island
0%
10%
20%
30%
40%
50%
60%
70%
80%
90%
100%
];
Chart
Dimension
Bucket_Island
Band
Expression
=Sum(Aggr(If(1/Count(TOTAL <Mandate_Number> Mandate_Number) <= Only({1}Bucket_Island) and 1/Count(TOTAL <Mandate_Number> Mandate_Number) > Above(Only({1}Bucket_Island)), 1), Mandate_Number, Band, Bucket_Island))
1,385 Views
13 Replies
MVP
2017-07-12
12:27 PM
- Mark as New
- Bookmark
- Subscribe
- Mute
- Subscribe to RSS Feed
- Permalink
- Report Inappropriate Content
Would you be able to share a sample to take a look at?
1,385 Views
Partner - Contributor III
2017-07-12
01:11 PM
Author
- Mark as New
- Bookmark
- Subscribe
- Mute
- Subscribe to RSS Feed
- Permalink
- Report Inappropriate Content
Thanks for the reply Sunny.
Here you go.
Regards Madhur
1,385 Views
MVP
2017-07-12
01:36 PM
- Mark as New
- Bookmark
- Subscribe
- Mute
- Subscribe to RSS Feed
- Permalink
- Report Inappropriate Content
Add a new table like this
LOAD * INLINE [
Bucket_Island
0%
10%
20%
30%
40%
50%
60%
70%
80%
90%
100%
];
Chart
Dimension
Bucket_Island
Band
Expression
=Sum(Aggr(If(1/Count(TOTAL <Mandate_Number> Mandate_Number) <= Only({1}Bucket_Island) and 1/Count(TOTAL <Mandate_Number> Mandate_Number) > Above(Only({1}Bucket_Island)), 1), Mandate_Number, Band, Bucket_Island))
1,386 Views
Partner - Contributor III
2017-07-12
02:24 PM
Author
- Mark as New
- Bookmark
- Subscribe
- Mute
- Subscribe to RSS Feed
- Permalink
- Report Inappropriate Content
Sunny,
This is working exactly the way i wanted. Im pretty new to Qlikview so would be great if you if could give explain me the logic behind measure calculation and How Often formula.
Thanks
Madhur
1,384 Views
MVP
2017-07-12
06:33 PM
- Mark as New
- Bookmark
- Subscribe
- Mute
- Subscribe to RSS Feed
- Permalink
- Report Inappropriate Content
How Often is a new field that I created in the script
LOAD * INLINE [
Bucket_Island
0%
10%
20%
30%
40%
50%
60%
70%
80%
90%
100%
];
And I am doing a Cartesian Product to get the solution you are looking to get
=Sum(Aggr(If(1/Count(TOTAL <Mandate_Number> Mandate_Number) <= Only({1}Bucket_Island) and 1/Count(TOTAL <Mandate_Number> Mandate_Number) > Above(Only({1}Bucket_Island)), 1), Mandate_Number, Band, Bucket_Island))
Used Aggr() to create a temporary table which includes the Bucket_Island as a dimension. and then I am doing a similar check which you wanted and were doing in your dimension before.
Calculated dimensions are less efficient and the way you did it seemed very complicated....
1,384 Views
Partner - Contributor III
2017-07-13
11:21 AM
Author
- Mark as New
- Bookmark
- Subscribe
- Mute
- Subscribe to RSS Feed
- Permalink
- Report Inappropriate Content
Okeh.
But dont you think we have thousand of Mandates Number than the performance in this solution would be compromised.
1,384 Views
MVP
2017-07-13
08:27 PM
- Mark as New
- Bookmark
- Subscribe
- Mute
- Subscribe to RSS Feed
- Permalink
- Report Inappropriate Content
Definitely will.... what other option do you have 
1,384 Views
Partner - Contributor III
2017-08-04
03:53 PM
Author
- Mark as New
- Bookmark
- Subscribe
- Mute
- Subscribe to RSS Feed
- Permalink
- Report Inappropriate Content
Hi Sunny,
Thanks for the help here and solution is working but I am facing one issue is this solution is that if I further drill down by clicking any number in the row where we more than one numbers it give me zero

like this I clicked 2 to see what are these two mandates but t gives me 0
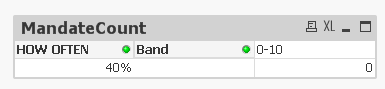
can we change your formula so that when we click 2 it should give me those values.. I am displaying these 2 values in separate data grid
1,384 Views
MVP
2017-08-06
08:40 PM
- Mark as New
- Bookmark
- Subscribe
- Mute
- Subscribe to RSS Feed
- Permalink
- Report Inappropriate Content
Not sure I follow what you want when you click on 2?
1,384 Views
- « Previous Replies
-
- 1
- 2
- Next Replies »