Unlock a world of possibilities! Login now and discover the exclusive benefits awaiting you.
- Qlik Community
- :
- All Forums
- :
- QlikView App Dev
- :
- Re: Show Text on Axis from Single Dimension
- Subscribe to RSS Feed
- Mark Topic as New
- Mark Topic as Read
- Float this Topic for Current User
- Bookmark
- Subscribe
- Mute
- Printer Friendly Page
- Mark as New
- Bookmark
- Subscribe
- Mute
- Subscribe to RSS Feed
- Permalink
- Report Inappropriate Content
Show Text on Axis from Single Dimension
Hello,
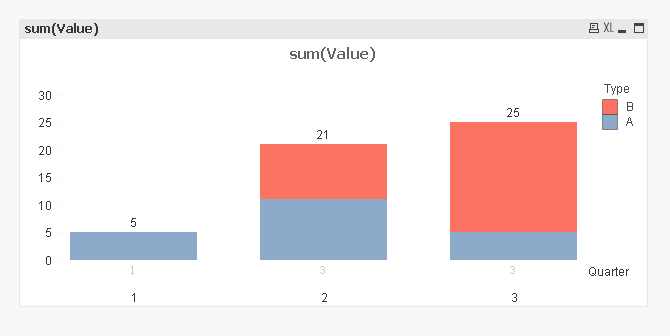
I have a chart with 2 dimensions and 2 expressions. The second expression is set to only show text on axis and I have an issue with it showing both values overlayed on each other. How do I get it to show the total count instead?
Thanks in advance!
-Jason
- Mark as New
- Bookmark
- Subscribe
- Mute
- Subscribe to RSS Feed
- Permalink
- Report Inappropriate Content
Would you be able to share your sample?
- Mark as New
- Bookmark
- Subscribe
- Mute
- Subscribe to RSS Feed
- Permalink
- Report Inappropriate Content
Hi Sunny,
Thanks for the quick response! Sample QVW attached.
-Jason
- Mark as New
- Bookmark
- Subscribe
- Mute
- Subscribe to RSS Feed
- Permalink
- Report Inappropriate Content
This?
Count(TOTAL <Quarter> [Type])
- Mark as New
- Bookmark
- Subscribe
- Mute
- Subscribe to RSS Feed
- Permalink
- Report Inappropriate Content
Hi Sunny,
That's very close. I forgot to mention that one of the dimensions is a group... how would I reference that instead of a field? I updated the sample with someone closer to what I have. I'm also using DISTINCT in the expression because I am actually using an ID field that contains duplicate ID values... will that cause issues with the expression?
- Mark as New
- Bookmark
- Subscribe
- Mute
- Subscribe to RSS Feed
- Permalink
- Report Inappropriate Content
This?
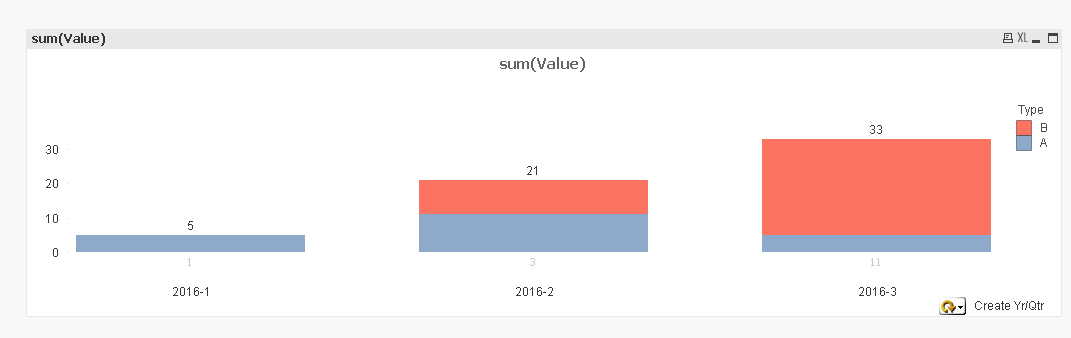
Couple of changes made:
1) Script change:
LOAD *,
[Create Year] & '-' & [Create Quarter] as CreateYearQtr,
[Close Year] & '-' & [Close Quarter] as CloseYearQtr;
LOAD * INLINE [
Type, Value, Create Quarter, Create Year, Close Quarter, Close Year
A, 5, 1, 2016, 1, 2016
A, 5, 2, 2016, 2, 2016
B, 10, 2, 2016, 2, 2016
A, 5, 3, 2016, 2, 2016
B, 10, 3, 2016, 3, 2016
A, 6, 2, 2016, 2, 2016
B, 10, 3, 2016, 3, 2016
B, 1, 3, 2016, 3, 2016
B, 1, 3, 2016, 3, 2016
B, 1, 3, 2016, 3, 2016
B, 1, 3, 2016, 3, 2016
B, 1, 3, 2016, 3, 2016
B, 1, 3, 2016, 3, 2016
B, 1, 3, 2016, 3, 2016
B, 1, 3, 2016, 3, 2016
];
2) New Expression:
If(Sum(Aggr(Count([Type]), $(=GetCurrentField([New Group])))) > 0,
Sum(Aggr(Count([Type]), $(=GetCurrentField([New Group])))), '')