Unlock a world of possibilities! Login now and discover the exclusive benefits awaiting you.
- Qlik Community
- :
- All Forums
- :
- QlikView App Dev
- :
- Show Unique count and Common count ?
- Subscribe to RSS Feed
- Mark Topic as New
- Mark Topic as Read
- Float this Topic for Current User
- Bookmark
- Subscribe
- Mute
- Printer Friendly Page
- Mark as New
- Bookmark
- Subscribe
- Mute
- Subscribe to RSS Feed
- Permalink
- Report Inappropriate Content
Show Unique count and Common count ?
Hi
I have the following type of data
| Model | Parts | Cost |
| A | P1 | 100 |
| A | P2 | 200 |
| A | P3 | 300 |
| B | P1 | 100 |
| B | P2 | 200 |
| B | P3 | 300 |
| B | P4 | 400 |
| B | P5 | 500 |
| C | P2 | 200 |
| C | P3 | 300 |
| C | P4 | 400 |
| D | P8 | 800 |
I want to show the following two question in Bar graph in qlik sense
How many parts are used accross models?
i.e As we can see in the above table, Parts:- P1,P2,P3,P4 are used in more than one model .
&
How many of the parts are unique ?
i.e As we can see in the above table Parts:- P5,P8 are used only in Model B and Model D respectively .
I want to show it in Bar graph
Were
Dimension = Model
Expession1 for count of parts in that model
Expression2 of count of unique parts in that model
Can anyone help me in this
thanks in advance
- Tags:
- qliksense qlikview
- Mark as New
- Bookmark
- Subscribe
- Mute
- Subscribe to RSS Feed
- Permalink
- Report Inappropriate Content
May be like?
Dimension - Model
Expressions are
i) Count(parts)
ii) Count(DISTINCT parts)
- Mark as New
- Bookmark
- Subscribe
- Mute
- Subscribe to RSS Feed
- Permalink
- Report Inappropriate Content
what is expected output in numbers?
- Mark as New
- Bookmark
- Subscribe
- Mute
- Subscribe to RSS Feed
- Permalink
- Report Inappropriate Content
Hi Gaurav,
Parts used in more than one model:
=concat(Aggr(if(Count(DISTINCT Model) >1,Parts),Parts),',')
returns
P1,P2,P3,P4
Parts used in only one model
=concat(Aggr(if(Count(DISTINCT Model) =1,Parts),Parts),',')
P5,P8
Your bar chart
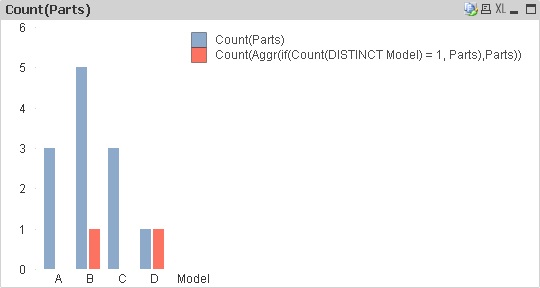
The blue bar shows number of parts, the red the number of parts used only in that model.
Cheers
Andrew
- Mark as New
- Bookmark
- Subscribe
- Mute
- Subscribe to RSS Feed
- Permalink
- Report Inappropriate Content
Thanks andrew for relpy
I also want the count of parts which are present in all the models ?
Can u help me in this
Thanks in advance