Unlock a world of possibilities! Login now and discover the exclusive benefits awaiting you.
- Qlik Community
- :
- All Forums
- :
- QlikView App Dev
- :
- Show legend when there is one dimension in Line ch...
- Subscribe to RSS Feed
- Mark Topic as New
- Mark Topic as Read
- Float this Topic for Current User
- Bookmark
- Subscribe
- Mute
- Printer Friendly Page
- Mark as New
- Bookmark
- Subscribe
- Mute
- Subscribe to RSS Feed
- Permalink
- Report Inappropriate Content
Show legend when there is one dimension in Line chart
Hi
I have a line chart in which there is one dimension(Date) and two expressions(Endorsement/Production) conditionally, then how would I show Endorsement/Production as a legend in my chart.
Please help.
Thanks
Saurabh
- Mark as New
- Bookmark
- Subscribe
- Mute
- Subscribe to RSS Feed
- Permalink
- Report Inappropriate Content
HI Saurabh..
Normally you dont have an option to show the legend for such conditional expression however, there is an workaround...
you can use a dummy dimension.. but make sure you don't use any actual field as dimension.
like in your case create 2 calculated dimensions
='Endorsement' , using the enable condition for Dimension same as the enable condition of expression , and label as something you want as title of you legend ..
and
='Production' same as was done for first dummy dimension/
This should solve your case
Check out the attached Demo App
- Mark as New
- Bookmark
- Subscribe
- Mute
- Subscribe to RSS Feed
- Permalink
- Report Inappropriate Content
Hi,
I'm not quite sure about your requirements, but one solution could be:
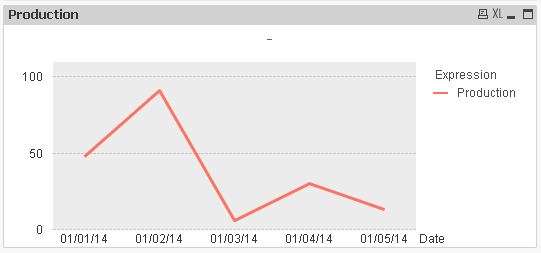

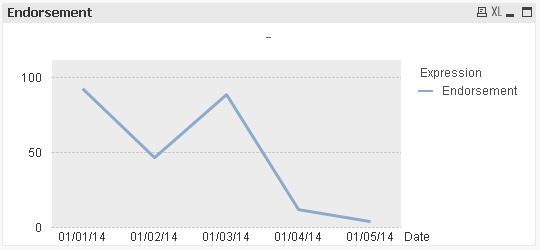

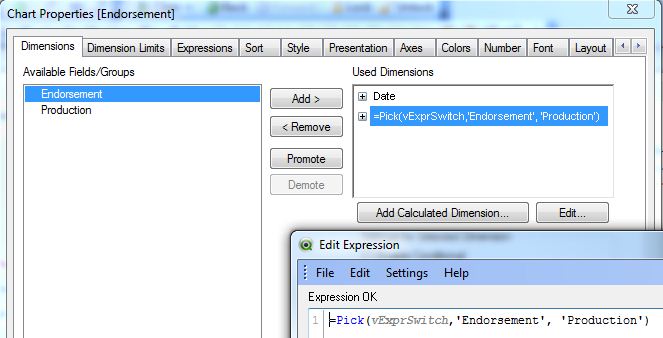
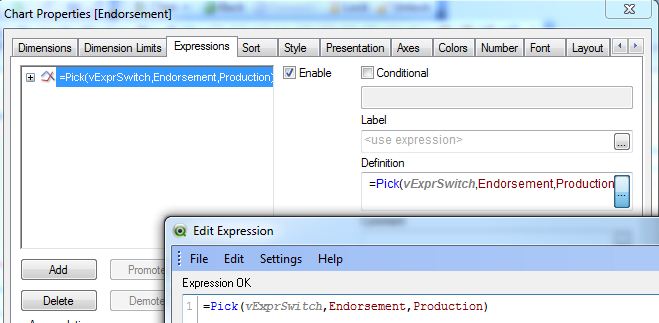
Instead of switching expressions with a button/variable, you can also combine independent expressions into one synthetic dimension using the valuelist() function:
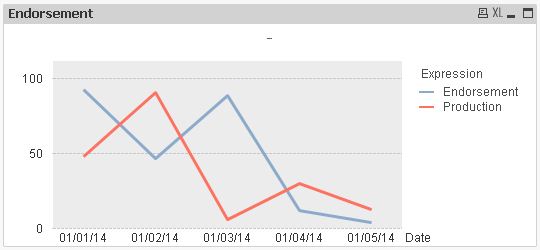

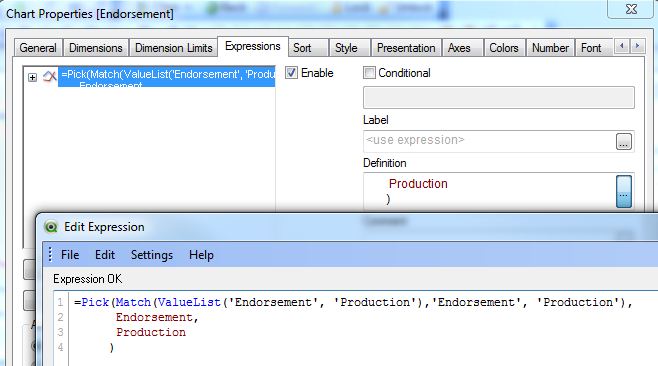
hope this helps
regards
Marco