Unlock a world of possibilities! Login now and discover the exclusive benefits awaiting you.
- Qlik Community
- :
- All Forums
- :
- QlikView App Dev
- :
- Show or hide rows based on set analysis
- Subscribe to RSS Feed
- Mark Topic as New
- Mark Topic as Read
- Float this Topic for Current User
- Bookmark
- Subscribe
- Mute
- Printer Friendly Page
- Mark as New
- Bookmark
- Subscribe
- Mute
- Subscribe to RSS Feed
- Permalink
- Report Inappropriate Content
Show or hide rows based on set analysis
Hi all,
I would like to show an specific range of data in a table chart. The selection is done by passing values from another field, but the result is not the expected. So I thing something is wrong in the expression in the table. Any ideas?
Please find attached file.
Thanks.
Marc.
Accepted Solutions
- Mark as New
- Bookmark
- Subscribe
- Mute
- Subscribe to RSS Feed
- Permalink
- Report Inappropriate Content
Hi Marc,
Try the expression below
=only({1<CanaldeVentaId=p(TecnicoId), InicioContratoEjercicioMes=p([FInicio EjercicioMes]), TipoRelacion={'R'}>} Contrato)
Guilherme
- Mark as New
- Bookmark
- Subscribe
- Mute
- Subscribe to RSS Feed
- Permalink
- Report Inappropriate Content
Hi Marc,
Try the expression below
=only({1<CanaldeVentaId=p(TecnicoId), InicioContratoEjercicioMes=p([FInicio EjercicioMes]), TipoRelacion={'R'}>} Contrato)
Guilherme
- Mark as New
- Bookmark
- Subscribe
- Mute
- Subscribe to RSS Feed
- Permalink
- Report Inappropriate Content
Guilherme,
It works fine. Thanks.
I tried now to add more info into the table, for instance TipoRelacion, but I can not avoid nulls.
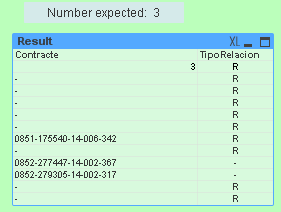
Any idea with this?
Thank you.
- Mark as New
- Bookmark
- Subscribe
- Mute
- Subscribe to RSS Feed
- Permalink
- Report Inappropriate Content
Sorry, solved by myself.
Thanks.