Unlock a world of possibilities! Login now and discover the exclusive benefits awaiting you.
- Qlik Community
- :
- All Forums
- :
- QlikView App Dev
- :
- Re: Re: Show some fields in scatter chart
- Subscribe to RSS Feed
- Mark Topic as New
- Mark Topic as Read
- Float this Topic for Current User
- Bookmark
- Subscribe
- Mute
- Printer Friendly Page
- Mark as New
- Bookmark
- Subscribe
- Mute
- Subscribe to RSS Feed
- Permalink
- Report Inappropriate Content
Show some fields in scatter chart
Hi guys,
I have 4 different variables. I'd like to show them together in 1 chart.
Is it possible?
Please find my attached file.
Thanks,
- Tags:
- new_to_qlikview
- Mark as New
- Bookmark
- Subscribe
- Mute
- Subscribe to RSS Feed
- Permalink
- Report Inappropriate Content
You don't have any stored variables, are you talking about putting 4 different dimensions into the same chart?
- Mark as New
- Bookmark
- Subscribe
- Mute
- Subscribe to RSS Feed
- Permalink
- Report Inappropriate Content
set a variable on each button click with different name
and use in chart label expression
=vShow &' '&'Effectiveness'
see the attched file
hope this make sense
- Mark as New
- Bookmark
- Subscribe
- Mute
- Subscribe to RSS Feed
- Permalink
- Report Inappropriate Content
By default the chart should show all tags for these 4 variables
I need to show all tags for each variable, but code them by colors. (in chart)
Like Channel should be green, Campaign -red, Organic search - yellow, Paid Search - blue.
Legend should be only Channel, Campaign, ... (legend)
Please find my sample file.
I combined only 2 variable
- Mark as New
- Bookmark
- Subscribe
- Mute
- Subscribe to RSS Feed
- Permalink
- Report Inappropriate Content
Maybe crosstable helps???
- Mark as New
- Bookmark
- Subscribe
- Mute
- Subscribe to RSS Feed
- Permalink
- Report Inappropriate Content
I'd like to have a chart, which shows all tags. The legend can be an image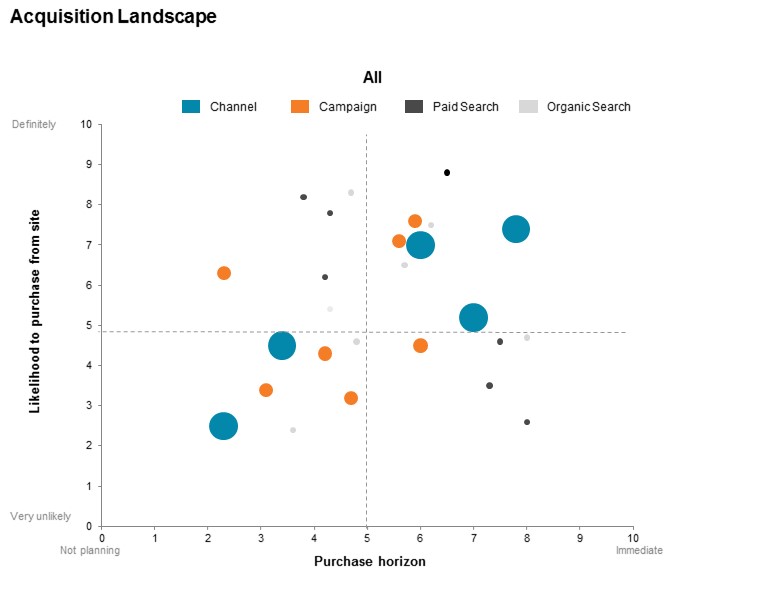
- Mark as New
- Bookmark
- Subscribe
- Mute
- Subscribe to RSS Feed
- Permalink
- Report Inappropriate Content
I resolved the issue.
I used crosstable command.
[Acquisition Landscape]:
CrossTable (Acquisition_Landscape,BBB)
LOAD respondentID,
[Channel] as "Channel ",
[Campaign] as "Campaign ",
[Keyword] as "Keyword "
// [Paid Keyword] as "Paid Search ",
// [Organic Keyword] as "Organic Search "
Resident File;
How to add dynamically legend in pop labels?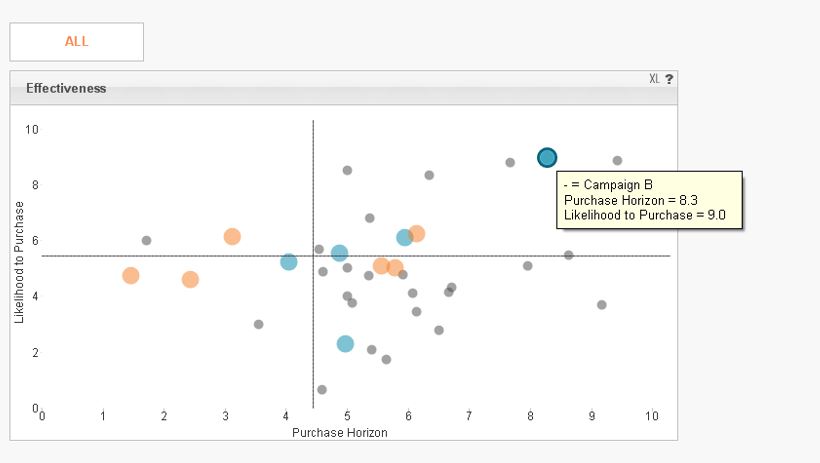
Thanks,
- Mark as New
- Bookmark
- Subscribe
- Mute
- Subscribe to RSS Feed
- Permalink
- Report Inappropriate Content
I was asked to add Search box for my chart.
I'd like to hide all bubbles, except of my wild search.
What should I change in my expressions?
Thanks,