Unlock a world of possibilities! Login now and discover the exclusive benefits awaiting you.
- Qlik Community
- :
- All Forums
- :
- QlikView App Dev
- :
- Re: Show unique values in pivot table
- Subscribe to RSS Feed
- Mark Topic as New
- Mark Topic as Read
- Float this Topic for Current User
- Bookmark
- Subscribe
- Mute
- Printer Friendly Page
- Mark as New
- Bookmark
- Subscribe
- Mute
- Subscribe to RSS Feed
- Permalink
- Report Inappropriate Content
Show unique values in pivot table
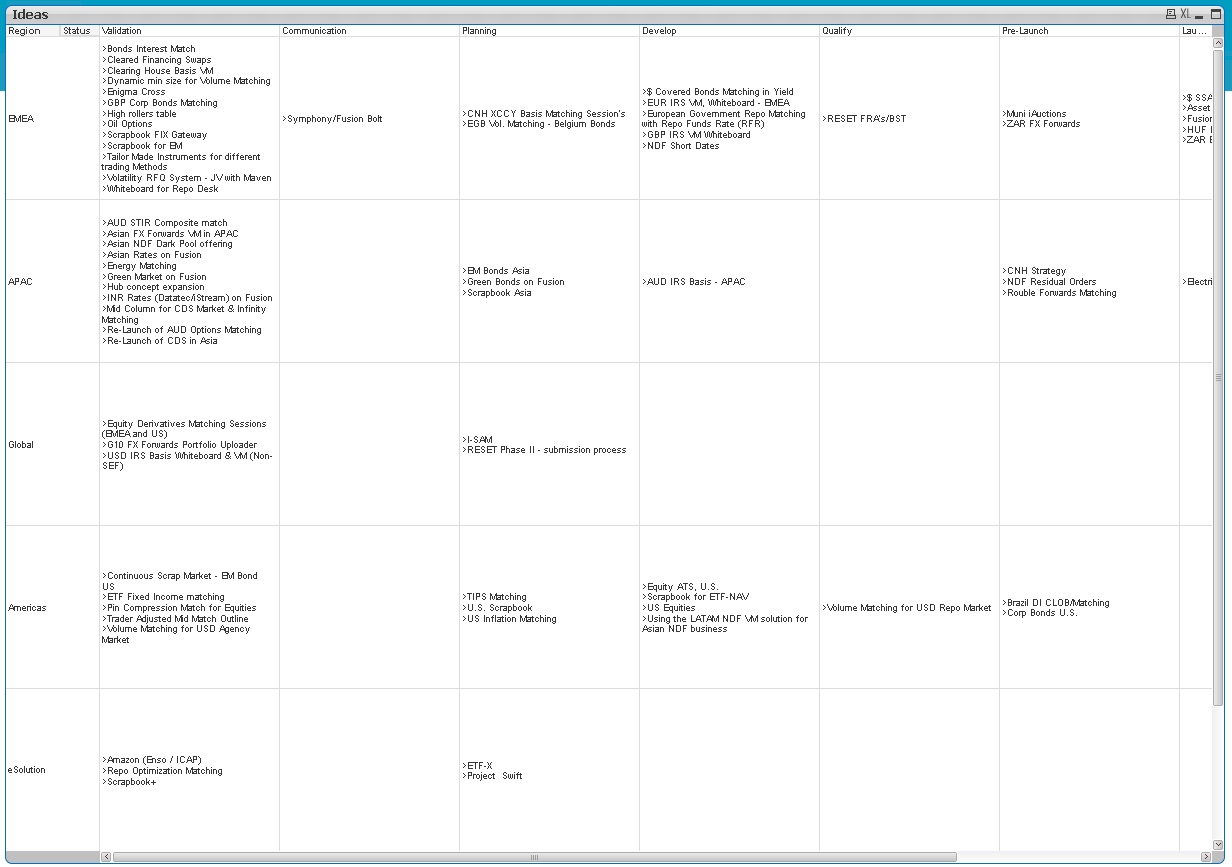
I have a pivot table showing 'Ideas' at various Statuses (x-axis dimension) by Region (y-axis dimension).

However it is only showing one Idea per region and stage, when I know for some there are multiple Ideas.
My expression is very simple:
=Ideas.Idea.Title
As are my dimensions, which simple list the field name. The are not calculated in any way.
How can i show ALL the ideas at each Status and Region?
- Mark as New
- Bookmark
- Subscribe
- Mute
- Subscribe to RSS Feed
- Permalink
- Report Inappropriate Content
For color write your expression as per below image: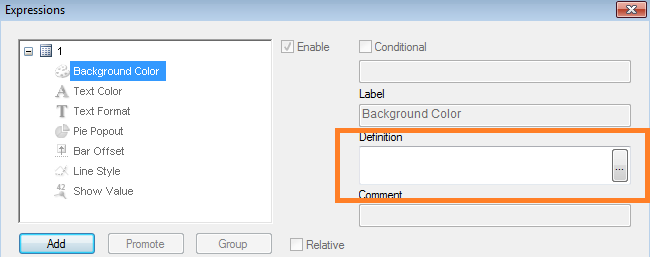
- Mark as New
- Bookmark
- Subscribe
- Mute
- Subscribe to RSS Feed
- Permalink
- Report Inappropriate Content
This would only work if all your ideas within the stage/region combination had the same priority. There's no way to do that unless each idea had a unique cell unfortunately.
- Mark as New
- Bookmark
- Subscribe
- Mute
- Subscribe to RSS Feed
- Permalink
- Report Inappropriate Content
Even for multiple rows or text IN THE SAME CELL?
- Mark as New
- Bookmark
- Subscribe
- Mute
- Subscribe to RSS Feed
- Permalink
- Report Inappropriate Content
I don't think you can color text of individual ideas in one cell.But you can color the complete cell by adding condition in the background color(thru '+' sign below the expression). I think this won't work if some of ideas are of high priority in same cell.
Not sure of color differences in same cell.
- Mark as New
- Bookmark
- Subscribe
- Mute
- Subscribe to RSS Feed
- Permalink
- Report Inappropriate Content
try Concat(distinct Ideas.Idea.Title)
- Mark as New
- Bookmark
- Subscribe
- Mute
- Subscribe to RSS Feed
- Permalink
- Report Inappropriate Content
That puts them in the same cell Celever.
Unfortunately i need to format each idea cell differently
- Mark as New
- Bookmark
- Subscribe
- Mute
- Subscribe to RSS Feed
- Permalink
- Report Inappropriate Content
try Aggr(Only(Ideas),Region,status)
Not sure but this may put each idea in different cell, not sure though..
- Mark as New
- Bookmark
- Subscribe
- Mute
- Subscribe to RSS Feed
- Permalink
- Report Inappropriate Content
That only shows a combination of Region/Status that has one idea.
If there are multiple ideas for a particular Region/Status it doesn't show that cell/column at all!
- Mark as New
- Bookmark
- Subscribe
- Mute
- Subscribe to RSS Feed
- Permalink
- Report Inappropriate Content
I'm so close! This is how I need the final table to look, BUT with each idea in a separate cell
In this case, I have simply Concatenated the ideas and inserted a line break
Is there no way this can be done?
- Mark as New
- Bookmark
- Subscribe
- Mute
- Subscribe to RSS Feed
- Permalink
- Report Inappropriate Content
I think you need to include all three fields as dimension so that each idea can appear in different line( which you don't want as you said initially to keep the chart short) but if there is no option suggested from others as well, you can think of going with it with a list box of priority, filtering red,orange, green only based on selection.
You can have one value always selected in list box( through list box property) so that chart shows important entries only while launching.