Unlock a world of possibilities! Login now and discover the exclusive benefits awaiting you.
- Qlik Community
- :
- All Forums
- :
- QlikView App Dev
- :
- Re: Show values on linear gauge
- Subscribe to RSS Feed
- Mark Topic as New
- Mark Topic as Read
- Float this Topic for Current User
- Bookmark
- Subscribe
- Mute
- Printer Friendly Page
- Mark as New
- Bookmark
- Subscribe
- Mute
- Subscribe to RSS Feed
- Permalink
- Report Inappropriate Content
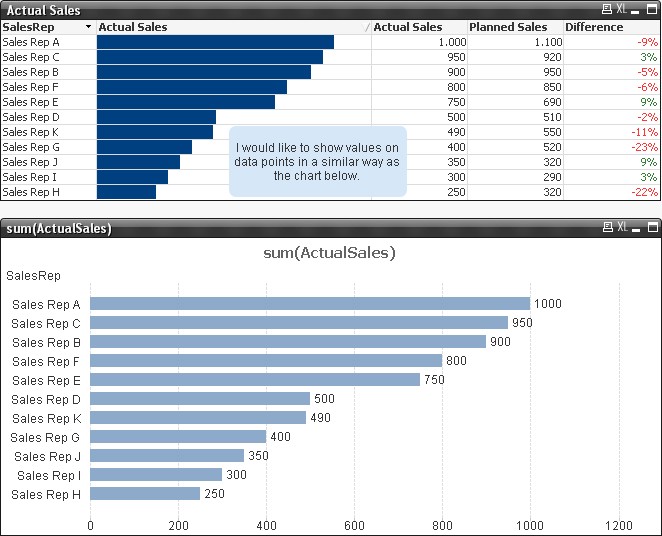
Show values on linear gauge
Hey,
I have a straight table with an expression displayed as "Linear Gauge". Is it possible to add "values on data points" like you can do on bar charts?
Please find the attached QVW file.
Regards,
Florian
- Mark as New
- Bookmark
- Subscribe
- Mute
- Subscribe to RSS Feed
- Permalink
- Report Inappropriate Content
Florian, did you ever figure out how to do this? I would like to do the same.
Thanks!
- Mark as New
- Bookmark
- Subscribe
- Mute
- Subscribe to RSS Feed
- Permalink
- Report Inappropriate Content
Hi Kate, unfortunately not ... does anybody else have an idea?
Regards,
Florian
- Mark as New
- Bookmark
- Subscribe
- Mute
- Subscribe to RSS Feed
- Permalink
- Report Inappropriate Content
don't think is possible; you can add an expression before the bar (I think you already know it) to look similar
- Mark as New
- Bookmark
- Subscribe
- Mute
- Subscribe to RSS Feed
- Permalink
- Report Inappropriate Content
Yep, it is possible, with a pretty ugly workaround.
I've just done a clone of the linear gauge table, overlayed it, and set the style background transparent.
And here's another answer on the same situation from Frank Hartmann:
you need to make two charts.
one chart that only contains the gauges and the second chart only containing the values. then you need to make backround of the second chart transparent and place it on top of the first chart.