Unlock a world of possibilities! Login now and discover the exclusive benefits awaiting you.
- Qlik Community
- :
- All Forums
- :
- QlikView App Dev
- :
- Re: Show year,Month and day in X-axis
Options
- Subscribe to RSS Feed
- Mark Topic as New
- Mark Topic as Read
- Float this Topic for Current User
- Bookmark
- Subscribe
- Mute
- Printer Friendly Page
Turn on suggestions
Auto-suggest helps you quickly narrow down your search results by suggesting possible matches as you type.
Showing results for
Contributor II
2018-07-30
02:25 PM
- Mark as New
- Bookmark
- Subscribe
- Mute
- Subscribe to RSS Feed
- Permalink
- Report Inappropriate Content
Show year,Month and day in X-axis
Hi,
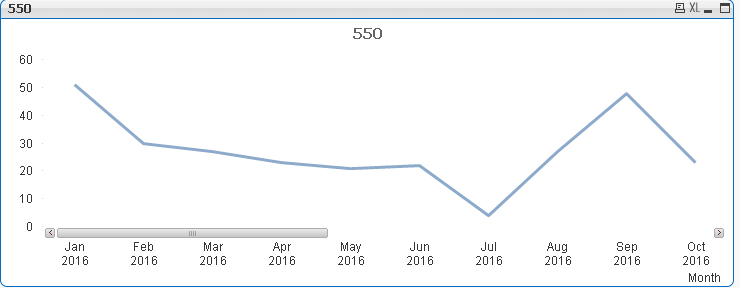
I wanted to show X-axis with Year,Month and Day as shown in the attached picture. Please find the attached image and let me know how to achieve this.
Thanks!
Sweety
3,071 Views
3 Replies
2018-07-31
12:08 AM
- Mark as New
- Bookmark
- Subscribe
- Mute
- Subscribe to RSS Feed
- Permalink
- Report Inappropriate Content
Try this approach Exclude Zero bars
Best Anil, When applicable please mark the correct/appropriate replies as "solution" (you can mark up to 3 "solutions". Please LIKE threads if the provided solution is helpful
2,952 Views
Master
2018-07-31
01:13 AM
- Mark as New
- Bookmark
- Subscribe
- Mute
- Subscribe to RSS Feed
- Permalink
- Report Inappropriate Content
May be like this:
The script:
LOAD *
,month(YearMonth) as Month
,year(YearMonth) as Year
;
LOAD
date(addmonths(makedate(2009,1,1),floor(rand()*24)),'YYYY MMM') as YearMonth
,ceil(rand()*10) as Amount
AUTOGENERATE 100
;
The line chart:
dimension=aggr(date(YearMonth,if(Month=min(total <Year> Month),'YYYY MMM',' MMM')),Year,YearMonth)
expression=sum(Amount)
Check this link:
2,953 Views
Creator III
2018-07-31
02:49 AM
- Mark as New
- Bookmark
- Subscribe
- Mute
- Subscribe to RSS Feed
- Permalink
- Report Inappropriate Content
Hi,
You can try like this
dimension= Month& chr(10) & Year