Unlock a world of possibilities! Login now and discover the exclusive benefits awaiting you.
- Qlik Community
- :
- All Forums
- :
- QlikView App Dev
- :
- Showing Graph with Top 10 and Restrictions
- Subscribe to RSS Feed
- Mark Topic as New
- Mark Topic as Read
- Float this Topic for Current User
- Bookmark
- Subscribe
- Mute
- Printer Friendly Page
- Mark as New
- Bookmark
- Subscribe
- Mute
- Subscribe to RSS Feed
- Permalink
- Report Inappropriate Content
Showing Graph with Top 10 and Restrictions
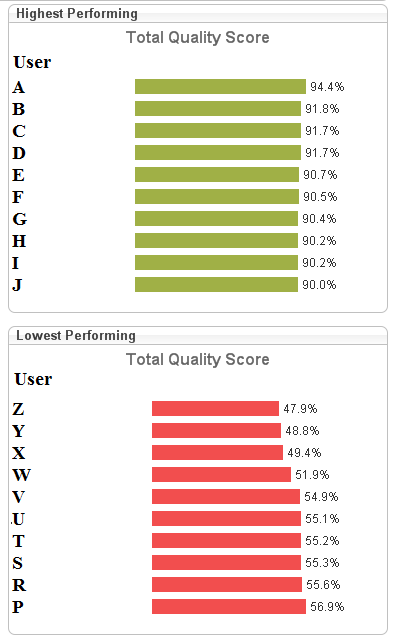
I am trying to create Top and Bottom performing graphs. Each will display the top and bottom 10 performers. Image is attached below.
I can get this to work easily using the Dimension Limits tab and setting this to largest 10 and smallest 10.
The issue is that I also want to limit Users to only those that have >49 members. Right now I am limiting the expression using the following:
- For Top 10 =if(sum(Count)>49,sum(Gap)/sum(Eligibility),-1)
- For Bottom 10 =if(sum(Count)>49,sum(Gap)/sum(Eligibility),2)
When no selections are made this logic works just fine and the Users with < 50 members aren't shown, however when a selection on User is made then members show up with -100% and +200%.
I cannot just set the values to 0 and exclude 0's because it is possible for a User to have a Quality Score of 0 and we would want that value to be included in the Bottom Performing list.
Thanks!

- Tags:
- dimension_limitation
- Mark as New
- Bookmark
- Subscribe
- Mute
- Subscribe to RSS Feed
- Permalink
- Report Inappropriate Content
try =if(sum(Count)>49,sum(Gap)/sum(Eligibility),null())
- Mark as New
- Bookmark
- Subscribe
- Mute
- Subscribe to RSS Feed
- Permalink
- Report Inappropriate Content
This gives me a 'No data to display' error message. I tried to just change the if statements to the following
=if(sum(Count)>49,sum(Gap)/sum(Eligibility))
but this also gave me the same error message.
- Mark as New
- Bookmark
- Subscribe
- Mute
- Subscribe to RSS Feed
- Permalink
- Report Inappropriate Content
I would recommend using the Dimension Limits if you are building in QV 11.