Unlock a world of possibilities! Login now and discover the exclusive benefits awaiting you.
- Qlik Community
- :
- All Forums
- :
- QlikView App Dev
- :
- Showing Status Changes on a timeline
- Subscribe to RSS Feed
- Mark Topic as New
- Mark Topic as Read
- Float this Topic for Current User
- Bookmark
- Subscribe
- Mute
- Printer Friendly Page
- Mark as New
- Bookmark
- Subscribe
- Mute
- Subscribe to RSS Feed
- Permalink
- Report Inappropriate Content
Showing Status Changes on a timeline
Hello
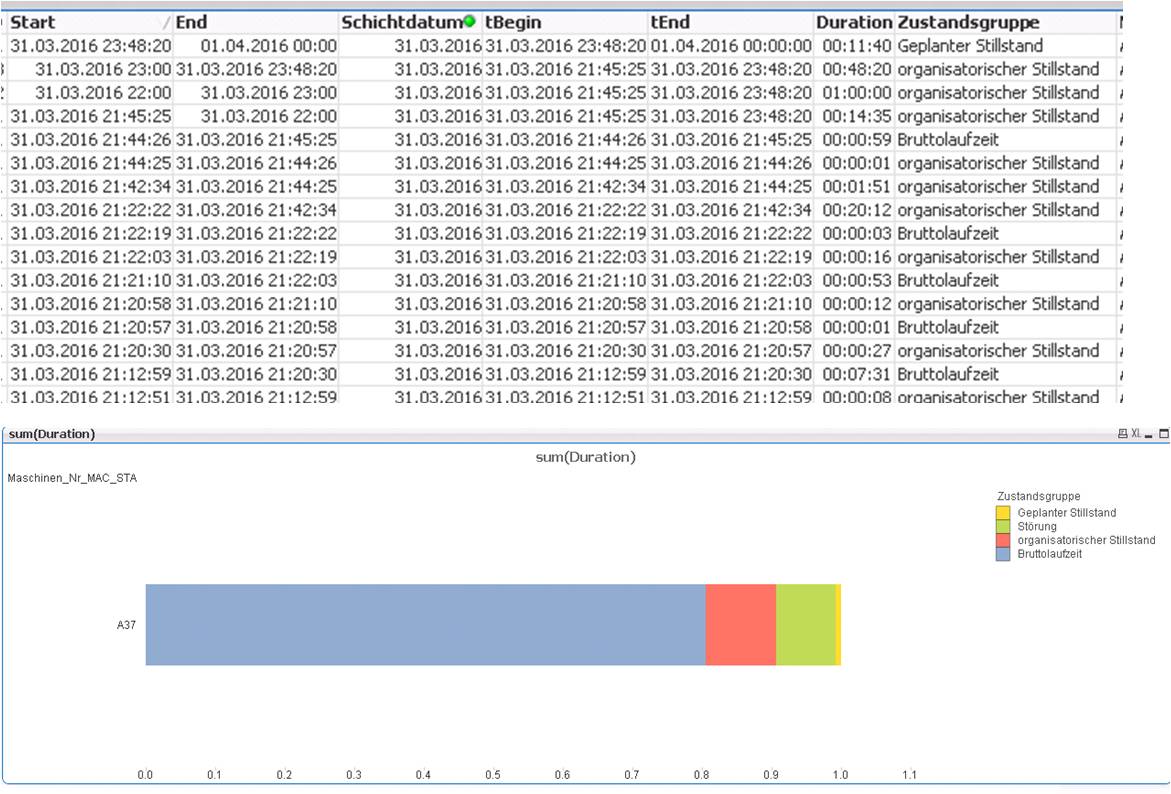
i have a log db with information on status.
I want to present this information on a timeline in a chart.
Unfortunately the chart shows only the status info in groups. Which dimention or sorting is missing so it shows is correctly?
Thx in advance

Accepted Solutions
- Mark as New
- Bookmark
- Subscribe
- Mute
- Subscribe to RSS Feed
- Permalink
- Report Inappropriate Content
So i figured it out:
the dimention should be as proposed by swuehl <timestamp>
the formula itself is sum(duration). In the example by swuehl 1 is used as formula - a suppose this can be done when your dimention and the granulatity of the data is the same.
in my case (dynamic length of a status) it was not possible to achieve like this as i would have needed the data on the granularity of 1 minute..
I hope it helps somebody for the furure:

p.s: dont forget to sort the timestamp.
cheers //chesterluck
- Mark as New
- Bookmark
- Subscribe
- Mute
- Subscribe to RSS Feed
- Permalink
- Report Inappropriate Content
Hi,
Unable to understand your requirement, kindly explain with detail and if possible share sample data.
Regards,
Kaushik Solanki
- Mark as New
- Bookmark
- Subscribe
- Mute
- Subscribe to RSS Feed
- Permalink
- Report Inappropriate Content
Your dimension should be a date or timestamp related to your status, maybe the Start field?
And have a look maybe in something like
- Mark as New
- Bookmark
- Subscribe
- Mute
- Subscribe to RSS Feed
- Permalink
- Report Inappropriate Content
So i figured it out:
the dimention should be as proposed by swuehl <timestamp>
the formula itself is sum(duration). In the example by swuehl 1 is used as formula - a suppose this can be done when your dimention and the granulatity of the data is the same.
in my case (dynamic length of a status) it was not possible to achieve like this as i would have needed the data on the granularity of 1 minute..
I hope it helps somebody for the furure:

p.s: dont forget to sort the timestamp.
cheers //chesterluck