Unlock a world of possibilities! Login now and discover the exclusive benefits awaiting you.
- Qlik Community
- :
- All Forums
- :
- QlikView App Dev
- :
- Showing Totals on Bar Charts
- Subscribe to RSS Feed
- Mark Topic as New
- Mark Topic as Read
- Float this Topic for Current User
- Bookmark
- Subscribe
- Mute
- Printer Friendly Page
- Mark as New
- Bookmark
- Subscribe
- Mute
- Subscribe to RSS Feed
- Permalink
- Report Inappropriate Content
Showing Totals on Bar Charts
I have created a Bar chart using Months as a dimension with a cost of sales as my expression (as per below):
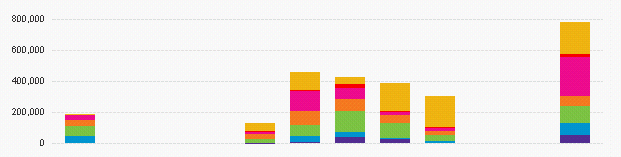
These are the 12 x months accross the year .. but how do I show a Year Total to the far right of this chart?
I was hoping for some kind of 'Show Total' tick box option but cannot see one?
Anyone have any ideas?
Thanks
- Mark as New
- Bookmark
- Subscribe
- Mute
- Subscribe to RSS Feed
- Permalink
- Report Inappropriate Content
Are you using QV11? And are you using only one dimension and several expressions in a stacked bar style?
In QV11 there is a total option now on dimension limits tab, and it seems to work fine with grouped bars, but when I select stacked style, the total bar seems not to be displayed right (I needed to set static max to show it correct).
- Mark as New
- Bookmark
- Subscribe
- Mute
- Subscribe to RSS Feed
- Permalink
- Report Inappropriate Content
Go to Chart Properties ----> Presentation and check the show total ( label)
VIjay
- Mark as New
- Bookmark
- Subscribe
- Mute
- Subscribe to RSS Feed
- Permalink
- Report Inappropriate Content
Hi Vijay
Thanks for you response.
I have already checked the show total (label) box and ensured this is ticked. I thought this would be the answer but unfortunately makes no difference.
Any other suggestions?
Bri.
- Mark as New
- Bookmark
- Subscribe
- Mute
- Subscribe to RSS Feed
- Permalink
- Report Inappropriate Content
Hi
Thanks for your reply, unfortunately I am using QV10.
I am using 2 dimensions (month and category) to produce the stacked split and one expression (the cost of sales).
Any other ideas?
- Mark as New
- Bookmark
- Subscribe
- Mute
- Subscribe to RSS Feed
- Permalink
- Report Inappropriate Content
It seems that QV doesn't like the two dimensions together with the total (played around a bit, the only way I got a total bar is that I created a total with one dimension, then having the option checked and total bar shown, I added second dimension. Ended up with a total bar of correct size, but not stacked by second dimension / multicolored).
Maybe you could apply adding a total value to your first dimension like discussed e.g. here:
http://community.qlik.com/message/92253
Regards,
Stefan
- Mark as New
- Bookmark
- Subscribe
- Mute
- Subscribe to RSS Feed
- Permalink
- Report Inappropriate Content
Thanks Stefan, I will do some playing around .. cheers for hte example!
Bri.