Unlock a world of possibilities! Login now and discover the exclusive benefits awaiting you.
- Qlik Community
- :
- All Forums
- :
- QlikView App Dev
- :
- Re: Showing cumulative sum while adding and deleti...
- Subscribe to RSS Feed
- Mark Topic as New
- Mark Topic as Read
- Float this Topic for Current User
- Bookmark
- Subscribe
- Mute
- Printer Friendly Page
- Mark as New
- Bookmark
- Subscribe
- Mute
- Subscribe to RSS Feed
- Permalink
- Report Inappropriate Content
Showing cumulative sum while adding and deleting records
Hi All,
I have the given data.
Want to create a bar chart showing days as dimension and count of site id as a measure. Month and year are given in selection.
My problem is to show, count of site ID based on site live date and site close date.
Suppose, I have 1000 ATM initially on 1st Nov 2016. On 2nd Nov 2016, 200 ATM are added, whereas 100 ATM are closed so it should the show 1000+200-100=1100 site ID. Similarly for all days of Nov month.
I also have the records Showing close date year 2099 which are not closed yet. So, they must be added to all the records.
Thnaks& Regards,
Jyoti
- Mark as New
- Bookmark
- Subscribe
- Mute
- Subscribe to RSS Feed
- Permalink
- Report Inappropriate Content
Would you be able to share the above data in an Excel format?
- Mark as New
- Bookmark
- Subscribe
- Mute
- Subscribe to RSS Feed
- Permalink
- Report Inappropriate Content
Hi Sunny,
I have attached the data file. Kindly, look after it.
Thanks in advance.
- Mark as New
- Bookmark
- Subscribe
- Mute
- Subscribe to RSS Feed
- Permalink
- Report Inappropriate Content
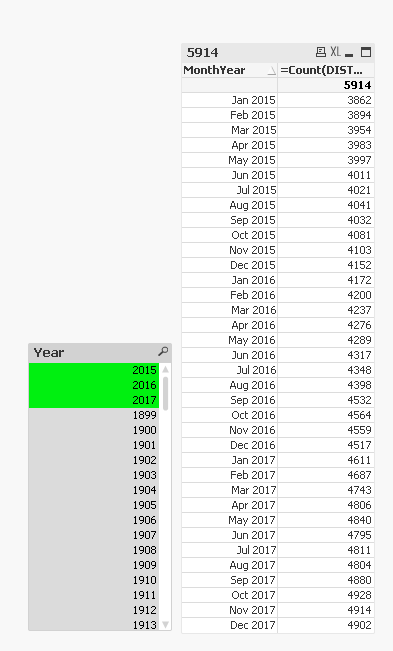
Does this looks like what you are looking to get?
- Mark as New
- Bookmark
- Subscribe
- Mute
- Subscribe to RSS Feed
- Permalink
- Report Inappropriate Content
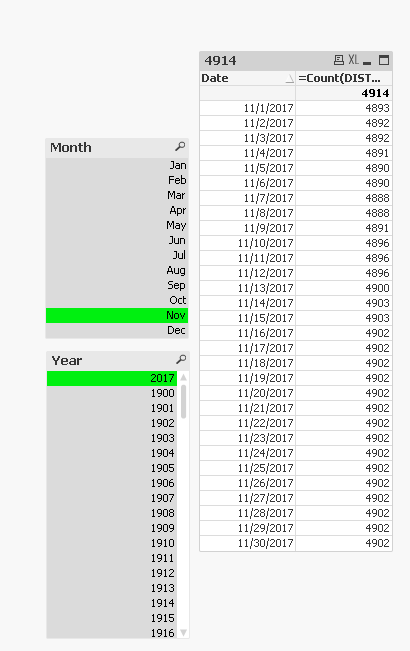
I want day wise data. Total count value should reflect all added records and substract deleted records on that particular day.
- Mark as New
- Bookmark
- Subscribe
- Mute
- Subscribe to RSS Feed
- Permalink
- Report Inappropriate Content
Just change the dimension to be Date
- Mark as New
- Bookmark
- Subscribe
- Mute
- Subscribe to RSS Feed
- Permalink
- Report Inappropriate Content
I not understanding how interval match will work here.
Could you please explain. In addition to this, how the records are increasing and decreasing in count.

- Mark as New
- Bookmark
- Subscribe
- Mute
- Subscribe to RSS Feed
- Permalink
- Report Inappropriate Content
Interval match looks for the start and end date and based on this information it determines if a particular ATM_ID is open or closed.... for example
ATM_ID 10 had a date range of 01/01/2017 to 31/03/2017... so based on this information, all dates between 01/01/2017 and 31/03/2017, the ATM_ID will be counted, rest of the dates, it will not be counted.
Does this make sense? Should answer both the questions for you....