Unlock a world of possibilities! Login now and discover the exclusive benefits awaiting you.
- Qlik Community
- :
- All Forums
- :
- QlikView App Dev
- :
- Showing data on bar chart as per requirement
- Subscribe to RSS Feed
- Mark Topic as New
- Mark Topic as Read
- Float this Topic for Current User
- Bookmark
- Subscribe
- Mute
- Printer Friendly Page
- Mark as New
- Bookmark
- Subscribe
- Mute
- Subscribe to RSS Feed
- Permalink
- Report Inappropriate Content
Showing data on bar chart as per requirement
Hi All,
Below is scenario,
I hve 2 FRQ Types A and Q
For FRQ type Q i have four quarters Q1, Q2,Q3 and Q4 and for FRQ type A i have Quarter Q4
i need to plot indicator value as per indicator name.
Each year i need to show indicator value FRQ type A(Q4 for FRQ type A).
only for each max year as per indicator name i need to show all quarters for FRQ type Q.
I have attached sample application.
Can you please suggest how shall i go ahead.
Thanks
- « Previous Replies
-
- 1
- 2
- Next Replies »
- Mark as New
- Bookmark
- Subscribe
- Mute
- Subscribe to RSS Feed
- Permalink
- Report Inappropriate Content
Hi,
do you want like the below screen shot
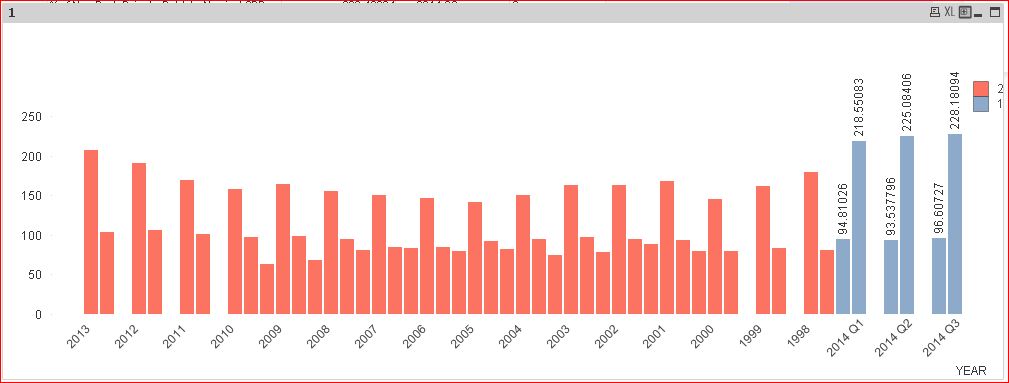
if so, try to change your year dimension as a Calculated dimension. put the expression like the below
=if(YEAR=$(vYear),YEAR&' '&QUARTER,YEAR)
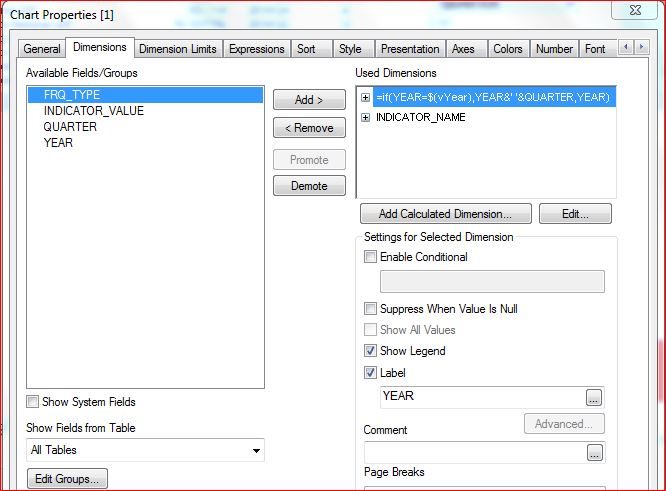
may be this would be helpful.
- Mark as New
- Bookmark
- Subscribe
- Mute
- Subscribe to RSS Feed
- Permalink
- Report Inappropriate Content
Hi,
Thanks, my output should be same like this but
if all years excepting max year FRQ type should A and for max year FRQ type should Q
for 1 indicator name only not for more than 1 indicator
thanks
- Mark as New
- Bookmark
- Subscribe
- Mute
- Subscribe to RSS Feed
- Permalink
- Report Inappropriate Content
Hi,
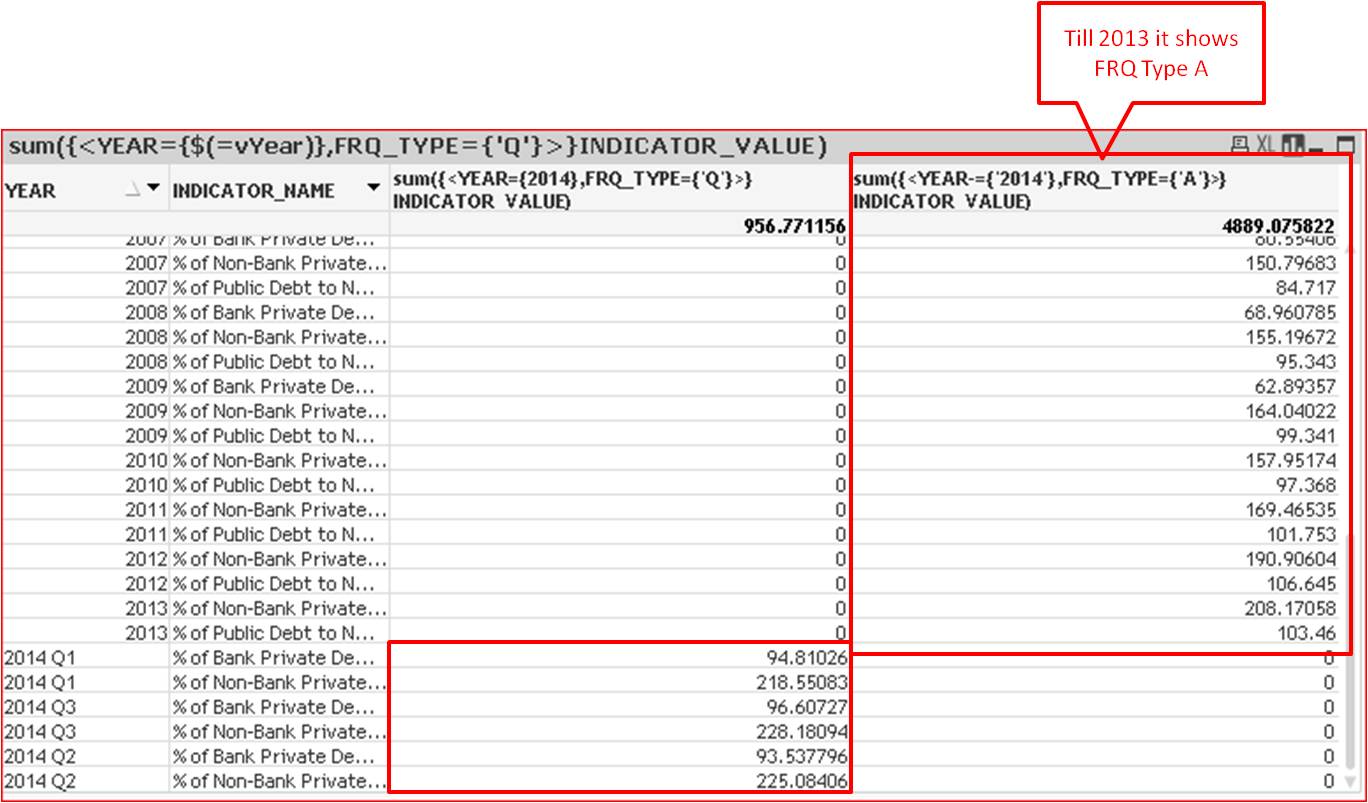
if i understand correctly, It is showing like that your requirement.
see the below screen shot in straight table.
- Mark as New
- Bookmark
- Subscribe
- Mute
- Subscribe to RSS Feed
- Permalink
- Report Inappropriate Content
Hi Settu,
Thanks for response shall we make it dynamically for each max year.and only for 1 indicator not more than one
Thanks
- Mark as New
- Bookmark
- Subscribe
- Mute
- Subscribe to RSS Feed
- Permalink
- Report Inappropriate Content
sorry deepak, not getting your point..
only for 1 indicator means?
- Mark as New
- Bookmark
- Subscribe
- Mute
- Subscribe to RSS Feed
- Permalink
- Report Inappropriate Content
hi,
thanks for response this is very helpful for me
for indicator name % of non bank private need to show year for frq type A and quarters for FRQ type Q for max year and for remaining years only FRQ type A indicator value.
thanks
- Mark as New
- Bookmark
- Subscribe
- Mute
- Subscribe to RSS Feed
- Permalink
- Report Inappropriate Content
Hi,
try this in your 2nd expression(Frq A)
=sum({<YEAR-={'$(vYear)'},FRQ_TYPE={'A'},INDICATOR_NAME={'% of Non-Bank Private Debt to Nominal GDP'}>}INDICATOR_VALUE)
the straight table looks like below
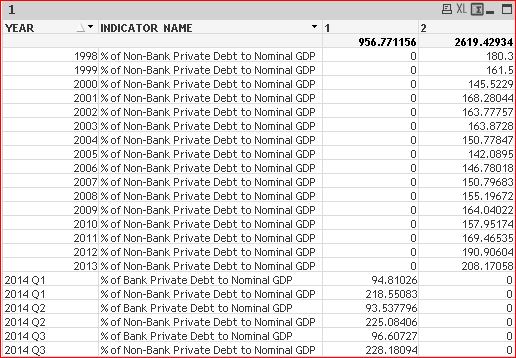
hope this would be helpful.
- « Previous Replies
-
- 1
- 2
- Next Replies »