Unlock a world of possibilities! Login now and discover the exclusive benefits awaiting you.
- Qlik Community
- :
- All Forums
- :
- QlikView App Dev
- :
- Re: Showing last value only
- Subscribe to RSS Feed
- Mark Topic as New
- Mark Topic as Read
- Float this Topic for Current User
- Bookmark
- Subscribe
- Mute
- Printer Friendly Page
- Mark as New
- Bookmark
- Subscribe
- Mute
- Subscribe to RSS Feed
- Permalink
- Report Inappropriate Content
Showing last value only
Dear all,
I tried finding a solution on the forum, but the related subjects I found get very detailed very quickly.
I have a list of data points, and since they are cumulative I just want to show the last one in a piechart. For example:
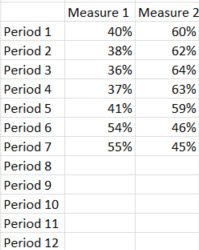
As mentioned, I would like to make a piechart to show how much each measure is part of the total. Since the periods are now blank but can be filled in the future ( and I want it to be automated ), how can I make this piechart so that it always takes the last period that has data?
I am using Qlik Cloud.
Thanks a lot !
- Tags:
- qlikview_scripting
- Mark as New
- Bookmark
- Subscribe
- Mute
- Subscribe to RSS Feed
- Permalink
- Report Inappropriate Content
not isnull()
- Mark as New
- Bookmark
- Subscribe
- Mute
- Subscribe to RSS Feed
- Permalink
- Report Inappropriate Content
Thank you Wade.
By using that formula, the piechart will not take the last value but will simply ignore 0 values, right? How would I still only the show last value and ignore the previous ones?
- Mark as New
- Bookmark
- Subscribe
- Mute
- Subscribe to RSS Feed
- Permalink
- Report Inappropriate Content
Hi!
Try to create a temp table and peek it out of there?
Later you can leave it as an external table or left join it.
YourTable:
LOAD *
Period as Period_Key,
Period,
....
//IF your Period is a numeric value or date
Tmp_MaxValue:
Load
max(Period) as Period
Resident YourTable
Where Measure1 <> null() and Measure2 <> null();
//IF your Period is a like shown in your example ("Period 1").
Tmp_MaxValue:
Load
Period
Resident YourTable
Where Measure1 <> null() and Measure2 <> null()
order by Period desc; //if this line does not work, then try the next line as last line
//order by subfield('Period', ' ', -1) desc; //then you only have the last number of Period 1.
let vMaxPeriod = num(peek('Period', '-1','Tmp_MaxValue')); // or peek('Period'('Period', '-1','Tmp_MaxValue') //Depends on num or text value
Left join(YourTable)
'$(vMaxPeriod)' as Period_Key,
1 as LastFlag
Autogenerate 1;
Now you can use it in your char in the SET analysis. example: sum({<{OtherParams=, LastFlag={1}}>}Measure1)
- Mark as New
- Bookmark
- Subscribe
- Mute
- Subscribe to RSS Feed
- Permalink
- Report Inappropriate Content
use peek function to lookup.
- Mark as New
- Bookmark
- Subscribe
- Mute
- Subscribe to RSS Feed
- Permalink
- Report Inappropriate Content
Thank you both,
Kalmer, the 1st option is the case, the period is a numeric value (1-12).
I am not sure what to do with the piece of coding you described. Where should I enter that? Not in the formula line I assume, right?
- Mark as New
- Bookmark
- Subscribe
- Mute
- Subscribe to RSS Feed
- Permalink
- Report Inappropriate Content
Hi RIanne,
Everything that has a Underline should be fixed to your code / tables / fields.
IN SCRIPT:
Tmp_MaxValue:
Load
max(Period) as Period
Resident YourTable
Where Measure1 <> null() and Measure2 <> null();
let vMaxPeriod = num(peek('Period', '-1','Tmp_MaxValue'));
Drop table Tmp_MaxValue;
Left join(YourTable)
'$(vMaxPeriod)' as Period_Key,
1 as LastFlag
Autogenerate 1;
IN EXPRESSION (SET ANALYSIS)
sum({<OtherParams=, LastFlag={1}>}Measure1)
OtherParams = other parameteres you have in the expression (if you need them, else can skip that):
sum({<LastFlag={1}>}Measure1)
Should work in a PieChart.
- Mark as New
- Bookmark
- Subscribe
- Mute
- Subscribe to RSS Feed
- Permalink
- Report Inappropriate Content
Hi Kalmer,
How would I write the code though? Currently the code I have is this:
Avg([MEASURE])
Can you put what code I should put in there? As you only underlined 'your table' I don't quite understand.
I am just using the function of the pie chart for the code. Should I enter the things you mentioned somewhere else?
- Mark as New
- Bookmark
- Subscribe
- Mute
- Subscribe to RSS Feed
- Permalink
- Report Inappropriate Content
In the chart expression:
Avg({<LastFlag={1}>} [MEASURE])
And the script where you build the dataset should have this line of code implemented in there.
YourTable should be the name of the table where the dimension "Measure" is residented. And this piece of code should be loaded after YourTable has been loaded. This is as easy i can make it for you.
Tmp_MaxValue:
Load
max(Period) as Period
Resident YourTable
Where Measure1 <> null() and Measure2 <> null();
let vMaxPeriod = num(peek('Period', '-1','Tmp_MaxValue'));
Drop table Tmp_MaxValue;
Left join(YourTable)
'$(vMaxPeriod)' as Period_Key,
1 as LastFlag
Autogenerate 1;
- Mark as New
- Bookmark
- Subscribe
- Mute
- Subscribe to RSS Feed
- Permalink
- Report Inappropriate Content
If you're having trouble with building the app and just started with Qlik i suggest strongly to go through the tutorials and How-To's on the Qlik site.
https://help.qlik.com/en-US/sense/June2018/Content/Tutorials/Tutorials-scripting-beginners.htm
There are also alot of videos which give you a good overview of the possibilities in different subjects.
New to Qlik Sense Videos
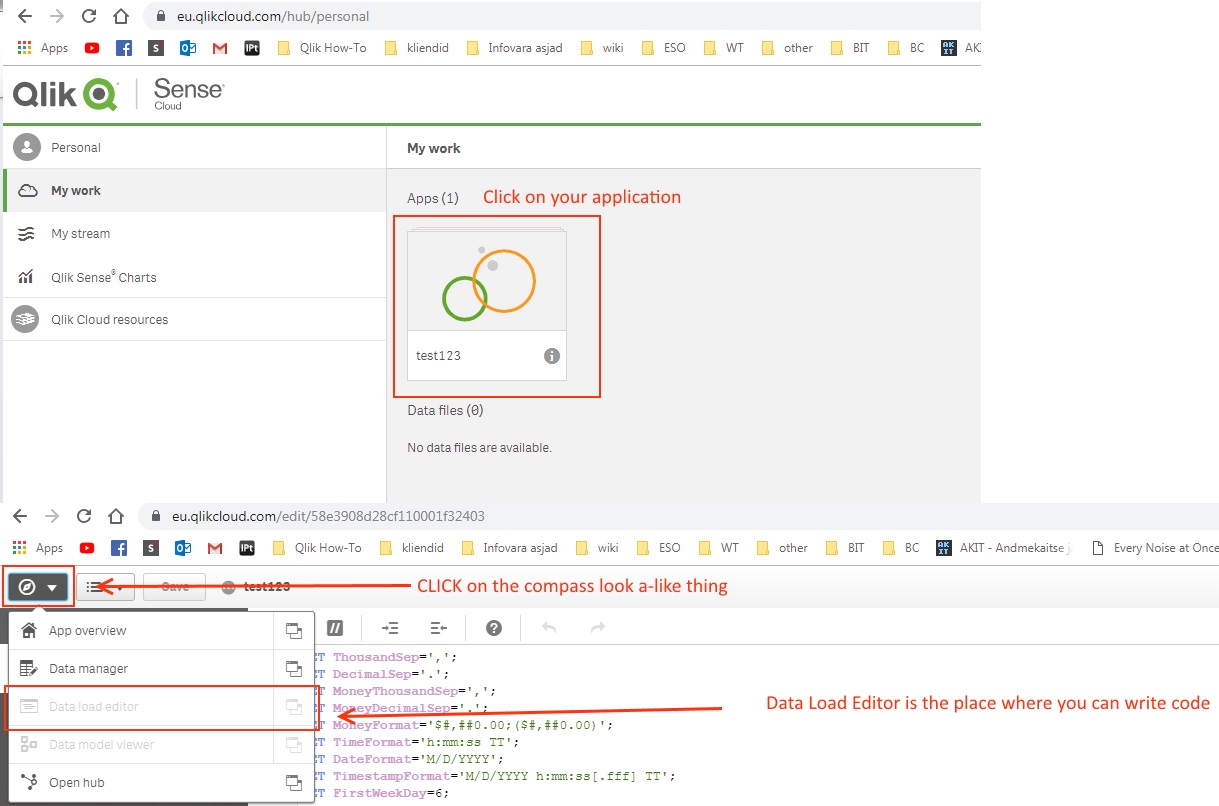
To Edit the code you should do the following: