Unlock a world of possibilities! Login now and discover the exclusive benefits awaiting you.
- Qlik Community
- :
- All Forums
- :
- QlikView App Dev
- :
- Re: Showing one datapoint for "several selections"...
- Subscribe to RSS Feed
- Mark Topic as New
- Mark Topic as Read
- Float this Topic for Current User
- Bookmark
- Subscribe
- Mute
- Printer Friendly Page
- Mark as New
- Bookmark
- Subscribe
- Mute
- Subscribe to RSS Feed
- Permalink
- Report Inappropriate Content
Showing one datapoint for "several selections"?
I had a really difficult time to Google this but consider that I have the following date:
| Date | Goals | Subcategory | Score |
|---|---|---|---|
| 2011-01-01 | Math | Teamwork | 2 |
| 2011-01-01 | Math | Leadership | 5 |
| 2011-01-01 | Math | Analytics | 6 |
| 2011-01-01 | English | Teamwork | 12 |
| 2011-01-01 | English | Leadership | 9 |
| 2011-01-01 | English | Analytics | 14 |
2011-06-01 | Math | Teamwork | 4 |
| 2011-06-01 | Math | Leadership | 3 |
| 2011-06-01 | Math | Analytics | 6 |
| 2011-06-01 | English | Teamwork | 10 |
| 2011-06-01 | English | Leadership | 7 |
| 2011-06-01 | English | Teamwork | 16 |
Obviously the real data has much more datapoints but the same amount of fields (four fields), I want to be able to show each individual score based one selection and I do not know how to achieve this.
I thought that I would make a diagram with Date, Goals and Subcategory as dimensions and Score as an expression, however this does not seem to work?What I am doing wrong and how would I be able to achieve this?
- « Previous Replies
-
- 1
- 2
- Next Replies »
- Mark as New
- Bookmark
- Subscribe
- Mute
- Subscribe to RSS Feed
- Permalink
- Report Inappropriate Content
I have personal edition so I cannot really see it but I can see the code:
LOAD Date,
Goals,
Subcategory,
Score,
Goals &'-'& Subcategory as GoalSubs
However, I can not see the structure of your graph, maybe you can take a printscreen of dimensions and expressions? Sorry if I am asking to much
- Mark as New
- Bookmark
- Subscribe
- Mute
- Subscribe to RSS Feed
- Permalink
- Report Inappropriate Content
Sure:
this is my script:
LOAD Date,
Goals,
Subcategory,
Score,
Goals &'-'& Subcategory as GoalsSubs
FROM
[http://community.qlik.com/thread/35702?tstart=0]
(html, codepage is 1252, embedded labels, table is @1, filters(
Remove(Row, Pos(Top, 14))
));
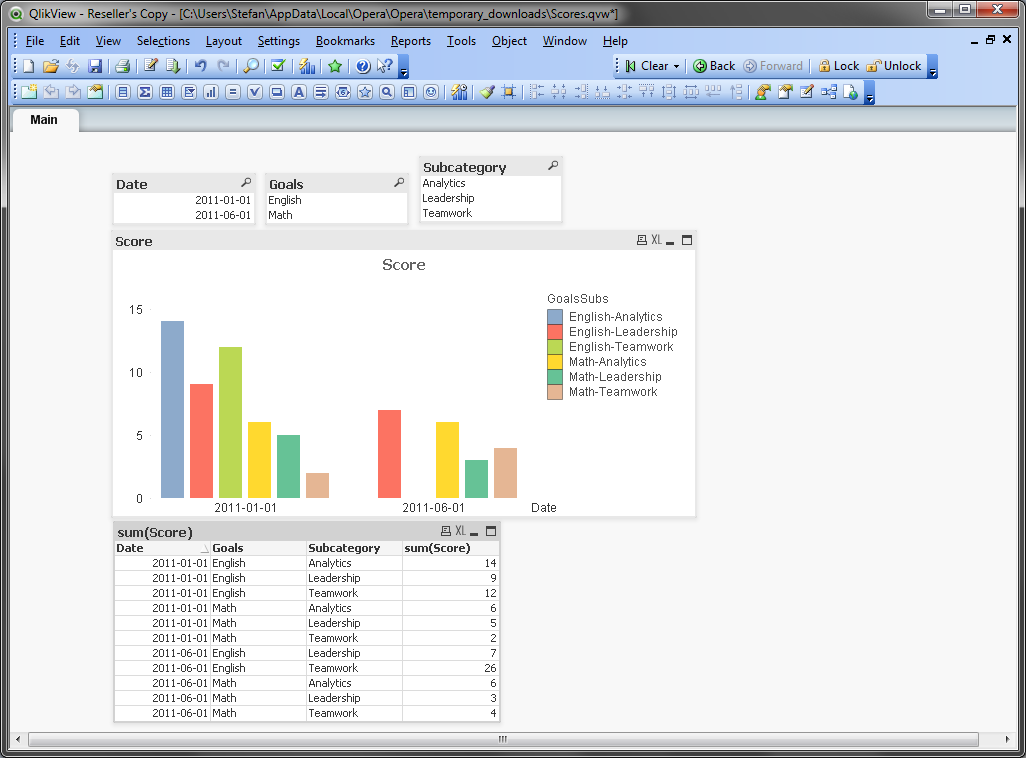
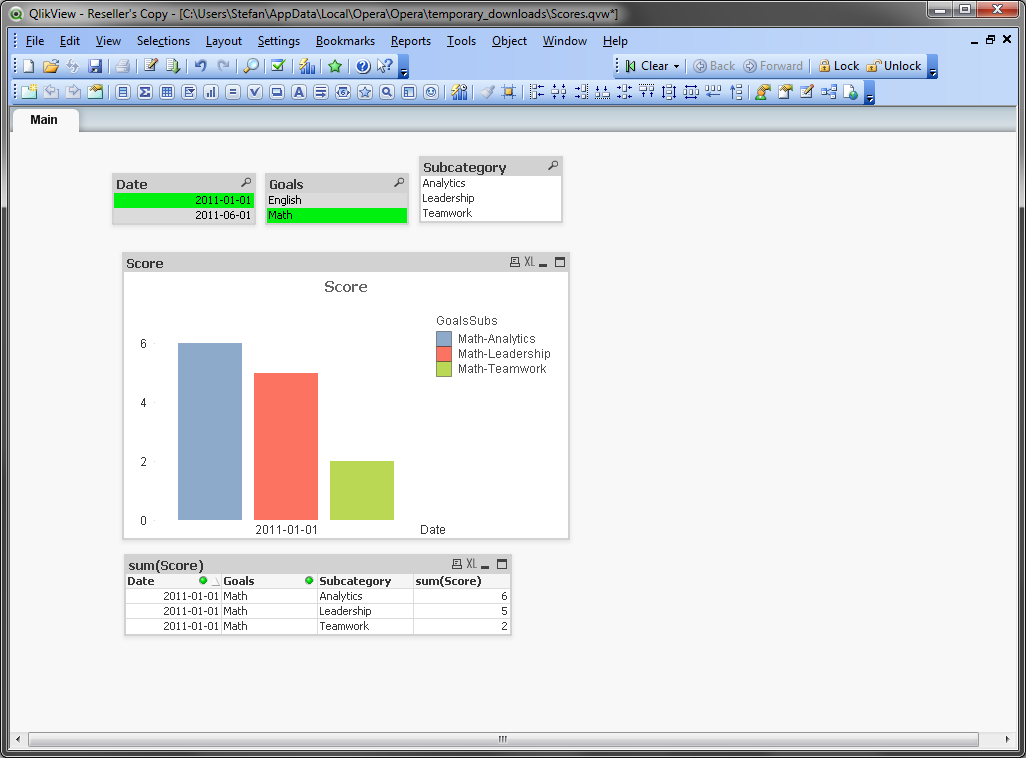
Then I did just bar chart with
dimensions Date and Goalssubs and Expression Score
It looks like this:
- Mark as New
- Bookmark
- Subscribe
- Mute
- Subscribe to RSS Feed
- Permalink
- Report Inappropriate Content
Another way to get the same output as shown by sweuhl is to create a calculated dimension of Goals and Subcategories in the chart dimensions.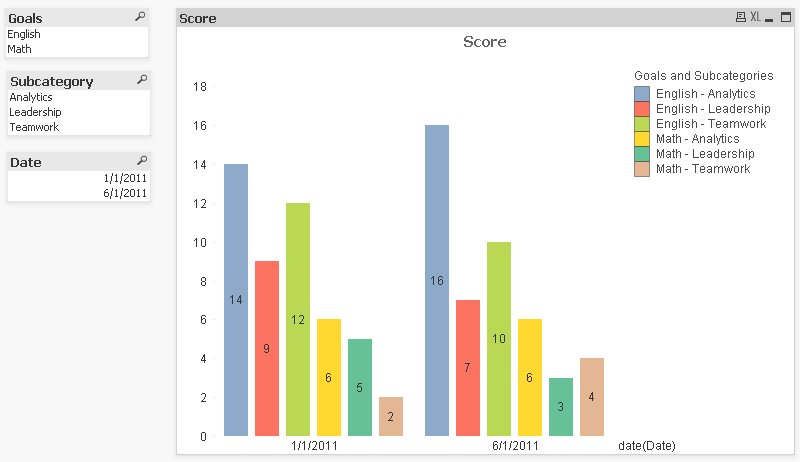
- Mark as New
- Bookmark
- Subscribe
- Mute
- Subscribe to RSS Feed
- Permalink
- Report Inappropriate Content
Thank you very much! I managed to solve it and you been very patient and helpful, big star for you my friend!
- Mark as New
- Bookmark
- Subscribe
- Mute
- Subscribe to RSS Feed
- Permalink
- Report Inappropriate Content
Do you know how to show the some in 1/1/2011 (48) as total and other date in this chart?
- Mark as New
- Bookmark
- Subscribe
- Mute
- Subscribe to RSS Feed
- Permalink
- Report Inappropriate Content
Good show stephen.
Can i do this without concatenation?
I want the same scenario like the attached screen.
" Sample_1 is the sample given by client "
" QV_Result is the report that i am getting in QV. "
I very well know i am doing a small mistake but i am not able to fix that.
Can you help me here?
Rgds,
Nandha
Attachments:
Sample_1.gif (83.2 K)
QV_Result.gif (107.3 K)


- « Previous Replies
-
- 1
- 2
- Next Replies »