Unlock a world of possibilities! Login now and discover the exclusive benefits awaiting you.
- Qlik Community
- :
- All Forums
- :
- QlikView App Dev
- :
- Shw
- Subscribe to RSS Feed
- Mark Topic as New
- Mark Topic as Read
- Float this Topic for Current User
- Bookmark
- Subscribe
- Mute
- Printer Friendly Page
- Mark as New
- Bookmark
- Subscribe
- Mute
- Subscribe to RSS Feed
- Permalink
- Report Inappropriate Content
Shw
Hi,
I have many data tables in below-mentioned tables (here I only showed two tables for example). Table1 consist of Production & recovery data and table2 consist of Sales data. Now My requirement is to show the data in Row-wise format as per below mentioned desired outputs. Output can be only dimension wise (as per output1) or It can be Plant or material wise (as per output2).
Kindly suggest how can I get the desired output.
| Table1 | Table2 | ||||||
| Plant | Material | Production | Recovery | Plant | Material | Sales | |
| 1001 | 10001 | 10 | 20 | 1001 | 10001 | 10 | |
| 1002 | 10001 | 20 | 30 | 1002 | 10001 | 20 | |
| 1003 | 10001 | 30 | 40 | 1003 | 10001 | 30 | |
| 1001 | 10002 | 40 | 10 | 1001 | 10002 | 40 | |
| 1002 | 10002 | 50 | 30 | 1002 | 10002 | 50 | |
| 1003 | 10002 | 60 | 40 | 1003 | 10002 | 60 | |
| 1001 | 10003 | 70 | 40 | 1001 | 10003 | 70 | |
| 1002 | 10003 | 80 | 30 | 1002 | 10003 | 80 | |
| 1003 | 10003 | 90 | 40 | 1003 | 10003 | 90 | |
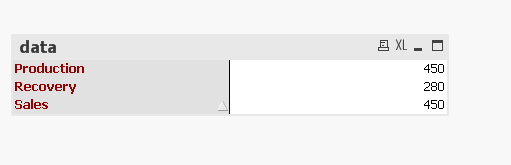
| Output1 | |
| Sales | 450 |
| Production | 450 |
| Recovery | 280 |
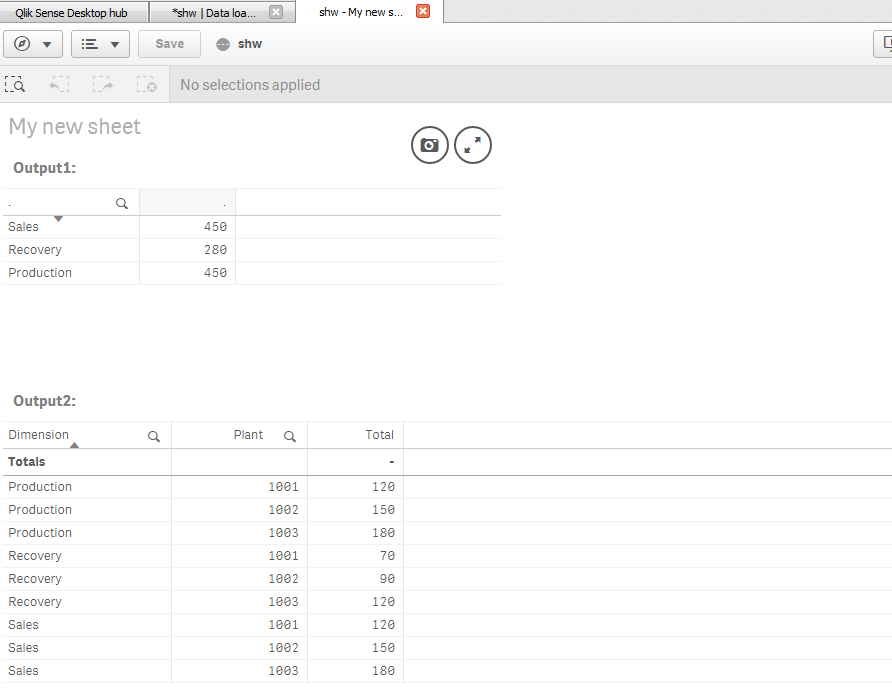
Output2 | ||
| Dimension | Plant | Total |
| Sales | 1001 | 120 |
| Sales | 1002 | 150 |
| Sales | 1003 | 180 |
| Production | 1001 | 120 |
| Production | 1002 | 150 |
| Production | 1003 | 180 |
| Recovery | 1001 | 70 |
| Recovery | 1002 | 90 |
| Recovery | 1003 | 120 |
- « Previous Replies
-
- 1
- 2
- Next Replies »
- Mark as New
- Bookmark
- Subscribe
- Mute
- Subscribe to RSS Feed
- Permalink
- Report Inappropriate Content
Hi Rakesh,
For output 1:
take pivot table without dimension. and expressions are
Sales: sum(Sales)
Production: sum(Production)
Recovery: sum(Recovery)
For output2:
dimensions: valuelist('Sales','Production','Recovery') , plant
expression : sum(Sales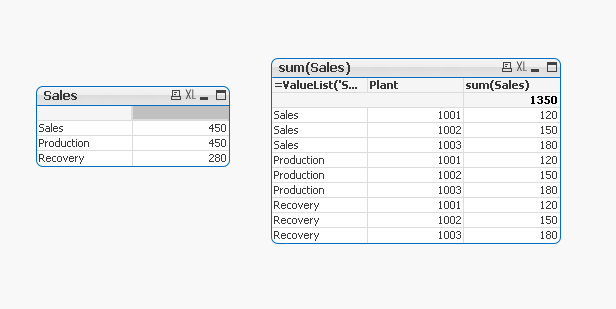 )
)
- Mark as New
- Bookmark
- Subscribe
- Mute
- Subscribe to RSS Feed
- Permalink
- Report Inappropriate Content
Hello Rakesh,
For Output 1 you can use straight table:
1)without any dimensions. Expressions as sum([Production]), etc.
2) In presentation tab check Horizontal column.


- Mark as New
- Bookmark
- Subscribe
- Mute
- Subscribe to RSS Feed
- Permalink
- Report Inappropriate Content
Hi,
I am using Qlik sense... Kindly suggest the solution in Qliksense.
- Mark as New
- Bookmark
- Subscribe
- Mute
- Subscribe to RSS Feed
- Permalink
- Report Inappropriate Content
Hi Rakesh,
Please download the attachment and try to understand.
- « Previous Replies
-
- 1
- 2
- Next Replies »