Unlock a world of possibilities! Login now and discover the exclusive benefits awaiting you.
- Qlik Community
- :
- All Forums
- :
- QlikView App Dev
- :
- Re: Simple Inter-record query
- Subscribe to RSS Feed
- Mark Topic as New
- Mark Topic as Read
- Float this Topic for Current User
- Bookmark
- Subscribe
- Mute
- Printer Friendly Page
- Mark as New
- Bookmark
- Subscribe
- Mute
- Subscribe to RSS Feed
- Permalink
- Report Inappropriate Content
Simple Inter-record query
I would like to determine the simple % change in price between one record set and another (between one day and the next), and ideally chart this. However I'm struggling to do this. I can do this in the qvd as part of the sql, but prefer to do it in the qvw as part of the expression.
( ClosingPrice[Current] - ClosingPrice[PreviousDay] )/ClosingPrice(PreviousDay)
On the current record, I'm attempting to query the previous price using the following expression. The expression is for a specific instrument, using the MakeDate function, using LadderYear, LadderMonth and LadderDay as the previous recorde date for that instrument. But this returns NULL value.
=avg(
{$<Instrument1={$(='[DOE Annual World Oil Demand]')}, LadderDate={$(=MakeDate($(LadderYear),$(LadderMonth),$(LadderDay))) }>} ClosingPriceUSD1
)
I have also tried the function Last. This also returns NULL value.
=Last( {$<Instrument1={$(='[DOE Annual World Oil Demand]')}>} ClosingPriceUSD1 )
I'm missing something fundamental here, as I would have thought this to be relatively simple to do. Any guidance people can offer, will be greatly appretciated.
Many thanks
- « Previous Replies
-
- 1
- 2
- Next Replies »
- Mark as New
- Bookmark
- Subscribe
- Mute
- Subscribe to RSS Feed
- Permalink
- Report Inappropriate Content
I just had this problem!
If you look at your chart as a straight table, you will see that the days are arranged vertically.
Try closingprice - above(closingprice) / above(closingprice) and it should straighten things out.
- Mark as New
- Bookmark
- Subscribe
- Mute
- Subscribe to RSS Feed
- Permalink
- Report Inappropriate Content
Thank you for the helpful response. I wasn't aware of the "above" function. But similiar to the Last function, it doesn't seem to like the expresion
=
Above(
{$<Instrument1={$(='[DOE Annual World Oil Demand]'))}> ClosingPriceUSD1
)
- Mark as New
- Bookmark
- Subscribe
- Mute
- Subscribe to RSS Feed
- Permalink
- Report Inappropriate Content
Thank you for the helpful response. I wasn't aware of the "above" function. But similiar to the Last function, it doesn't seem to like the expresion.
Are these functions invalid in expression with set analysis?
=
Above(
{$<Instrument1={$(='[DOE Annual World Oil Demand]'))}> ClosingPriceUSD1
)
even the following doesn't work
=Above(ClosingPriceUSD1)
returns NULL
- Mark as New
- Bookmark
- Subscribe
- Mute
- Subscribe to RSS Feed
- Permalink
- Report Inappropriate Content
Those functions (last, above, etc.) work fine with set analysis. I am using them with set analysis in several applications...
How are you looking at your data? I recommend looking at it as a straight table while you are figuring out all of your equations, and then charting the results, rather than trying to do it as a bar or line chart directly.
The Chart inter-record functions help info is very useful as well!
- Mark as New
- Bookmark
- Subscribe
- Mute
- Subscribe to RSS Feed
- Permalink
- Report Inappropriate Content
I'm using a simple table with the dimension of LadderYear,LadderMonth,LadderDay, and Instrument.
Expression as ClosingPriceUSD and trying to create an expression for the previous day ClosingPriceUSD using Last, Above, MakeDate....anything that allows me to move across the record set without changing the current record.
- Mark as New
- Bookmark
- Subscribe
- Mute
- Subscribe to RSS Feed
- Permalink
- Report Inappropriate Content
If you want to show me your data, I'll see if I can do anything with it.
- Mark as New
- Bookmark
- Subscribe
- Mute
- Subscribe to RSS Feed
- Permalink
- Report Inappropriate Content
Oh, I know why your chart inter-record functions aren't working!
It's because you have too many dimensions.
If you go LadderYear, LadderMonth, LadderDay, QlikView will look at all of the records in one "Day" as a block, and inter-record functions only function within a block.
For example, I had a bug where I sorted by Year(date) and Month(date) and did month/month analysis.
Using the code sum(policies) / above(sum(policies)),
My table looked like:
2012 2013
Oct Nov Dec Jan Feb
- 97% 98% - 96%
However using MonthName(date) I was able to have January show up as non-blank.
Rather than creating Year, Month, and Day, I recommend just using Date. Above() will then work normally.
- Mark as New
- Bookmark
- Subscribe
- Mute
- Subscribe to RSS Feed
- Permalink
- Report Inappropriate Content
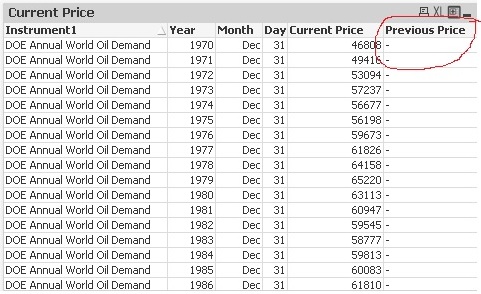
Here's the data - nothing really compilcated at all.
Expression for previous price is =above({$<Instrument1={$('[DOE Annual World Oil Demand]')}>} ClosingPriceUSD1)

- Mark as New
- Bookmark
- Subscribe
- Mute
- Subscribe to RSS Feed
- Permalink
- Report Inappropriate Content
Yeah, like I thought, it's because of your dimensions. If you're looking for year over year comparisons, try re-ordering your dimensions like this:
Dimensions:
Instrument1
Month
Day
Year
and you should be able to use the above() function.
- « Previous Replies
-
- 1
- 2
- Next Replies »