Unlock a world of possibilities! Login now and discover the exclusive benefits awaiting you.
- Qlik Community
- :
- All Forums
- :
- QlikView App Dev
- :
- Re: Single scroll bar for two charts in a containe...
- Subscribe to RSS Feed
- Mark Topic as New
- Mark Topic as Read
- Float this Topic for Current User
- Bookmark
- Subscribe
- Mute
- Printer Friendly Page
- Mark as New
- Bookmark
- Subscribe
- Mute
- Subscribe to RSS Feed
- Permalink
- Report Inappropriate Content
Single scroll bar for two charts in a container.. Urgent...!!!!!!!
Dear Community,
I have two charts placed in a container. Those two charts have different scroll bars. But the data in those two charts were same. So I need a single scroll bar on which I can view data in both charts.
Instead of those two scroll bars I need a single scroll bar for those two charts
Any help will be appreciated.
Thanks a ton in advance.
Regards
Manideep
- « Previous Replies
-
- 1
- 2
- Next Replies »
Accepted Solutions
- Mark as New
- Bookmark
- Subscribe
- Mute
- Subscribe to RSS Feed
- Permalink
- Report Inappropriate Content
See attached.
All charts have the same dimension Num. The slider is using the field Num in multi value mode. You can drag the end and the beginning values of the slider, and after that click in the middle part of the slider and move it left or right.
Technically it is just a selection in the Num field. Just looks and feels differently.
- Mark as New
- Bookmark
- Subscribe
- Mute
- Subscribe to RSS Feed
- Permalink
- Report Inappropriate Content
Hi Manideep,
Try to show both the Mean and MR in single chart. Is it so difficult to show?
Sai
- Mark as New
- Bookmark
- Subscribe
- Mute
- Subscribe to RSS Feed
- Permalink
- Report Inappropriate Content
Thanks Prasad. Yes I already had that in my mind. But I need to show in two different charts. So I am trying to get that. Can you please let me know how can I achieve that?
Regards,
Manideep
- Mark as New
- Bookmark
- Subscribe
- Mute
- Subscribe to RSS Feed
- Permalink
- Report Inappropriate Content
The closest solution I can think of, after the single chart, is a selection in the date field.. Maybe using multi-value slider for a closer presentation - but no scrolls in the charts.
- Mark as New
- Bookmark
- Subscribe
- Mute
- Subscribe to RSS Feed
- Permalink
- Report Inappropriate Content
Hi Michael,
Can I achieve the same or similar to that with Sliders instead of scroll bars. If so, Please let me know how can I do that?
- Mark as New
- Bookmark
- Subscribe
- Mute
- Subscribe to RSS Feed
- Permalink
- Report Inappropriate Content
See attached.
All charts have the same dimension Num. The slider is using the field Num in multi value mode. You can drag the end and the beginning values of the slider, and after that click in the middle part of the slider and move it left or right.
Technically it is just a selection in the Num field. Just looks and feels differently.
- Mark as New
- Bookmark
- Subscribe
- Mute
- Subscribe to RSS Feed
- Permalink
- Report Inappropriate Content
Hi Michael,
It looks some what better. But with Slider the data get filtered. So without filtering the data how can I do this? Because there are many columns in other tables related to the column in Slider. Please help me.
- Mark as New
- Bookmark
- Subscribe
- Mute
- Subscribe to RSS Feed
- Permalink
- Report Inappropriate Content
Michael,
Otherwise, On leaving that object if I can get the previous selections that can also be helpful for me.
- Mark as New
- Bookmark
- Subscribe
- Mute
- Subscribe to RSS Feed
- Permalink
- Report Inappropriate Content
Hi
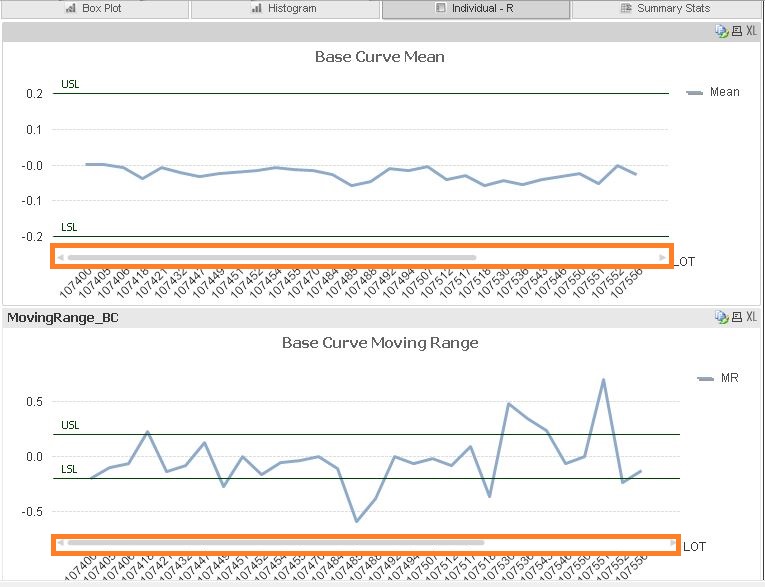
My first Image shows what I want. I set slider for both charts in a container. Now I can able to see both charts data using slider.
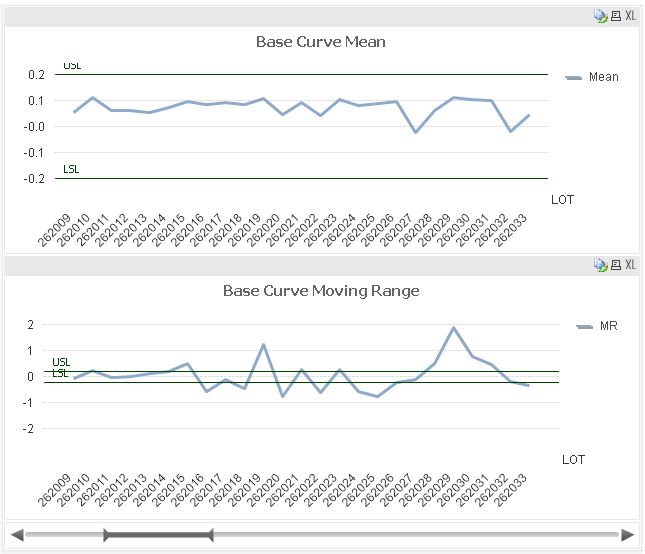
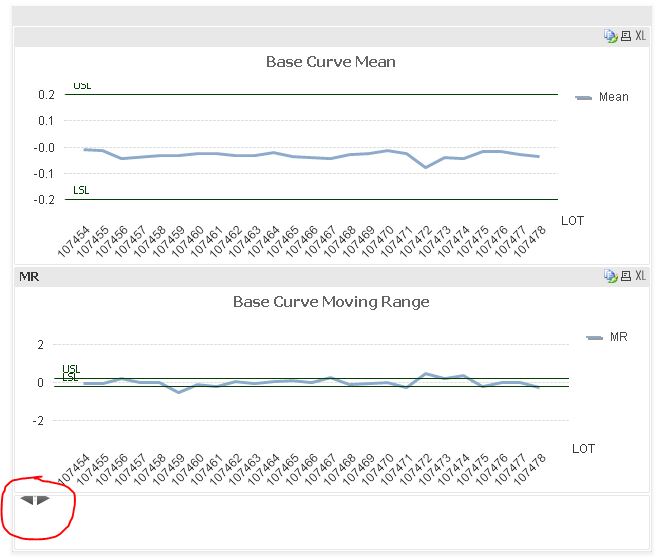
But some times when I try to move the slider. Its getting compressed to the corner in a container. please see the image below for reference. please help me on this.
Thanks
Manideep
- Mark as New
- Bookmark
- Subscribe
- Mute
- Subscribe to RSS Feed
- Permalink
- Report Inappropriate Content
Any help please....!!!!!
- « Previous Replies
-
- 1
- 2
- Next Replies »