Unlock a world of possibilities! Login now and discover the exclusive benefits awaiting you.
- Qlik Community
- :
- All Forums
- :
- QlikView App Dev
- :
- Re: Small Challenge!
- Subscribe to RSS Feed
- Mark Topic as New
- Mark Topic as Read
- Float this Topic for Current User
- Bookmark
- Subscribe
- Mute
- Printer Friendly Page
- Mark as New
- Bookmark
- Subscribe
- Mute
- Subscribe to RSS Feed
- Permalink
- Report Inappropriate Content
Small Challenge!
Hello Experts!
I'm trying to present data in a straight table where I need to show Name, future data and previous total average count.
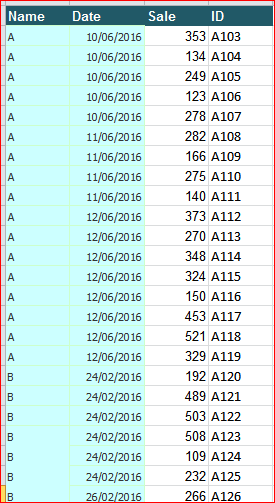
My data looks like this:
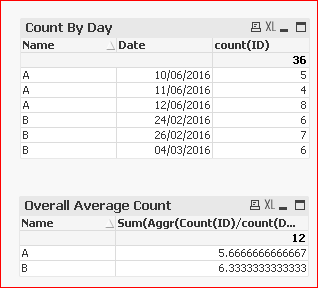
So if I do a count of ID per day and overall, I should get something like this:
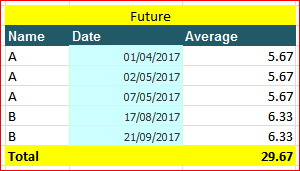
Now, What I want to show is a straight table that should have the Name, future dates, these average values.
it should look something like this:
Is this something we can do in Qlik?
Thanks
- « Previous Replies
- Next Replies »
- Mark as New
- Bookmark
- Subscribe
- Mute
- Subscribe to RSS Feed
- Permalink
- Report Inappropriate Content
You can do all the things you mention, but I won't really know what the end goal is.... You have only been sharing bits and pieces of the information. I can only help you with something I know... You can use this to fix the sum up top
Sum(TOTAL <Name>
Aggr(If(Count({<[Future Dates]>}ID) = 0,
Sum({<[Future Dates]>} TOTAL <Name>
Aggr(If(Rank(Only({<ID = {"=Len(Only({<[Future Dates]>}ID)) > 1"}, [Future Dates]>} Date)) < 4, Count({<[Future Dates]>}ID)), Name, Date))/
Count({<[Future Dates]>}TOTAL <Name>
Aggr(If(Rank(Only({<ID = {"=Len(Only({<[Future Dates]>}ID)) > 1"}, [Future Dates]>} Date)) < 4, Only({<[Future Dates]>}Date)), Name, Date))), Name, Date))
But this may not be perfect still. So, do consider your other options
- Mark as New
- Bookmark
- Subscribe
- Mute
- Subscribe to RSS Feed
- Permalink
- Report Inappropriate Content
Thank you! Much appreciate your help.
- « Previous Replies
- Next Replies »