Unlock a world of possibilities! Login now and discover the exclusive benefits awaiting you.
- Qlik Community
- :
- All Forums
- :
- QlikView App Dev
- :
- Sort computed x axis
- Subscribe to RSS Feed
- Mark Topic as New
- Mark Topic as Read
- Float this Topic for Current User
- Bookmark
- Subscribe
- Mute
- Printer Friendly Page
- Mark as New
- Bookmark
- Subscribe
- Mute
- Subscribe to RSS Feed
- Permalink
- Report Inappropriate Content
Sort computed x axis
Hello, i need to know how to sort an x dimension of a graph in order to have the dates ordered.
The computed dimension is: =[Month] & '/' & [Year]
that in the graph is showed like the figure attached.
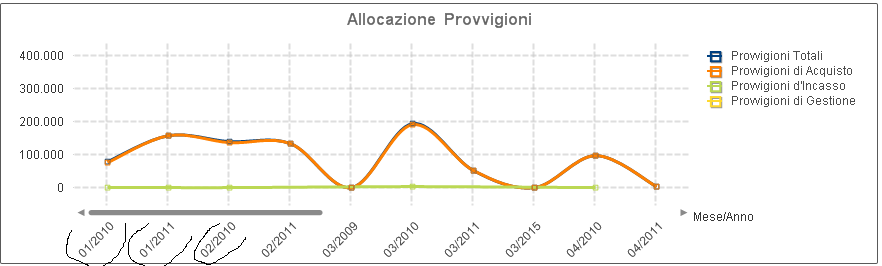
How can i do to get this field ordered by month and year?
Thanks
Marco
Accepted Solutions
- Mark as New
- Bookmark
- Subscribe
- Mute
- Subscribe to RSS Feed
- Permalink
- Report Inappropriate Content
Hello, Marco
When you create MonthYear field use dual function, smth like below:
=dual([Month]&'/'&[Year],[Year]*100+[Month])
And sort as number Ascending.
Hope this helps.
Regards,
Andrei
- Mark as New
- Bookmark
- Subscribe
- Mute
- Subscribe to RSS Feed
- Permalink
- Report Inappropriate Content
post your sample app
- Mark as New
- Bookmark
- Subscribe
- Mute
- Subscribe to RSS Feed
- Permalink
- Report Inappropriate Content
Hello, Marco
When you create MonthYear field use dual function, smth like below:
=dual([Month]&'/'&[Year],[Year]*100+[Month])
And sort as number Ascending.
Hope this helps.
Regards,
Andrei
- Mark as New
- Bookmark
- Subscribe
- Mute
- Subscribe to RSS Feed
- Permalink
- Report Inappropriate Content
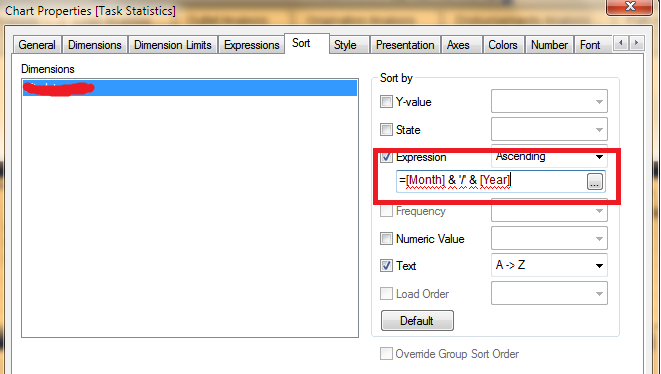
Hi Marco,
You can go to the sort tab. Uncheck all the checkboxes. Check the expression box and enter you expression into it. Please see screenshot:
- Mark as New
- Bookmark
- Subscribe
- Mute
- Subscribe to RSS Feed
- Permalink
- Report Inappropriate Content
Switch places for Month and Year in your calculated dimension.
- Mark as New
- Bookmark
- Subscribe
- Mute
- Subscribe to RSS Feed
- Permalink
- Report Inappropriate Content
With dual it works.
Thanks
Marco
- Mark as New
- Bookmark
- Subscribe
- Mute
- Subscribe to RSS Feed
- Permalink
- Report Inappropriate Content
You can also write the expression on the chart or use Max(Date) if you have date field.