Unlock a world of possibilities! Login now and discover the exclusive benefits awaiting you.
- Qlik Community
- :
- All Forums
- :
- QlikView App Dev
- :
- Re: Sorting Conditional Dimensions
- Subscribe to RSS Feed
- Mark Topic as New
- Mark Topic as Read
- Float this Topic for Current User
- Bookmark
- Subscribe
- Mute
- Printer Friendly Page
- Mark as New
- Bookmark
- Subscribe
- Mute
- Subscribe to RSS Feed
- Permalink
- Report Inappropriate Content
Sorting Conditional Dimensions
I am building a straight table with conditional dimensions based on the "Whats New in QV11" example. But I am finding that I cannot control the sort. Even looking at the QV example (tab: Reports) it does not seem to work.
Is anyone else experiencing this and do you have a workaround?
- Mark as New
- Bookmark
- Subscribe
- Mute
- Subscribe to RSS Feed
- Permalink
- Report Inappropriate Content
Updating this, I submitted this issue to QlikView Support. They haven't confirmed it yet but the word is that this is a bug related to the use of conditional dimensions. I will keep this updated as I get confirmation or workaround.
So for now, be aware of this issue when using conditional dimensions.
- Mark as New
- Bookmark
- Subscribe
- Mute
- Subscribe to RSS Feed
- Permalink
- Report Inappropriate Content
I'm also 'fighting' with this sort issue. ![]()
- Mark as New
- Bookmark
- Subscribe
- Mute
- Subscribe to RSS Feed
- Permalink
- Report Inappropriate Content
It was aknowledged as a bug 12/20/11. Hopefully the first service release will address it. It is a shame. Such an awesome feature that makes an upgrade completely worthwhile, rendered useless because you can't sort the report.
- Mark as New
- Bookmark
- Subscribe
- Mute
- Subscribe to RSS Feed
- Permalink
- Report Inappropriate Content
hi Aaron,has sr2 solved this problem? It puzzles me a lot!
- Mark as New
- Bookmark
- Subscribe
- Mute
- Subscribe to RSS Feed
- Permalink
- Report Inappropriate Content
There is a workaround:
For each of the conditional dimensions:
1. Put the condition in some variable. E.g. you have dimension "City", you could have a variable vShowCity (if vShowCity =1, dimenson City should appear).
2. Use the variable in calculatiing the dimension in calculated dimension. E.g., the calculated dimension "City" should look like =if(vShowCity =1, City).
3. Use the variable to show/hide the dimension column (in chart properties Presentation tab).
- Mark as New
- Bookmark
- Subscribe
- Mute
- Subscribe to RSS Feed
- Permalink
- Report Inappropriate Content
I'm struggling with this issue when using conditional dimensions in a bar chart.
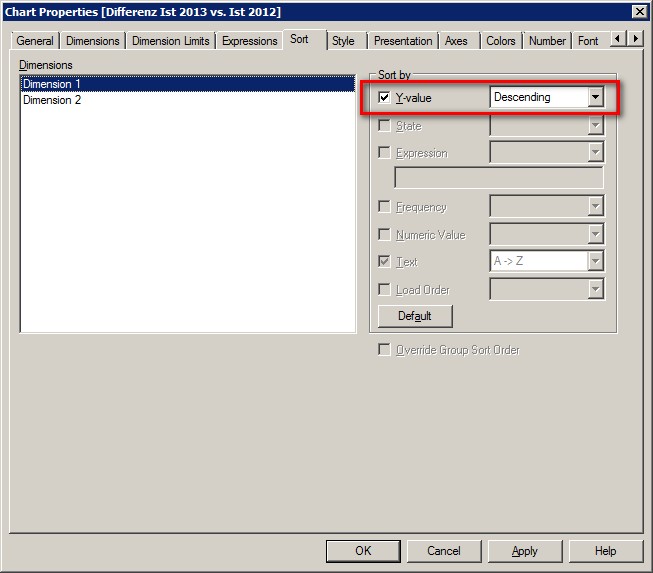
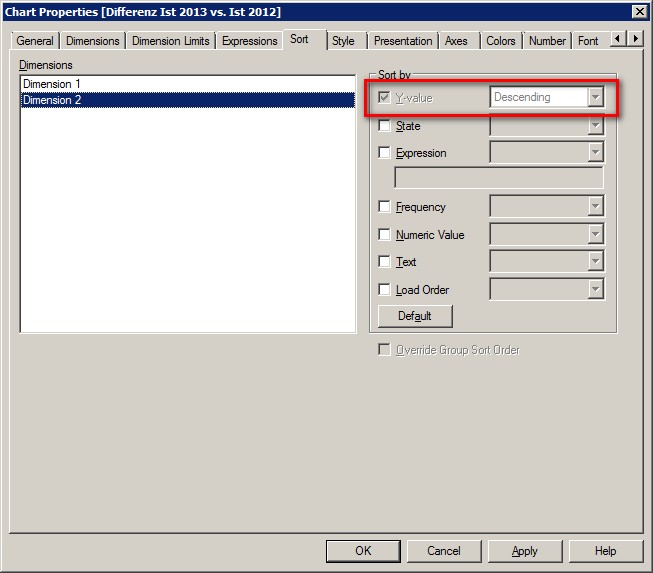
I want to conditionally display Dimension 1 or Dimension 2.
Qlikview lets me sort by Y-value for Dimension 1 but not for Dimension 2.


Unfortunately your workaround doesn't apply here as the presentation tab of bar charts doesn't offer a "Conditional" input field.
Is there any other approach? For my simplified example (please find the attached qvw) I could simply add "Sort by expression" sum(Value).
But in my real life chart I also have some complex conditional expressions. Sort by Y-value would the neatest way ...
Regards,
Florian
- Mark as New
- Bookmark
- Subscribe
- Mute
- Subscribe to RSS Feed
- Permalink
- Report Inappropriate Content
Does anybody have an idea?
Regards,
Florian
- Mark as New
- Bookmark
- Subscribe
- Mute
- Subscribe to RSS Feed
- Permalink
- Report Inappropriate Content
I know this is an old post but I ran into this issue recently and was able to create a workaround that worked in my specific application. I created a calculated dimension with the nested dimensions listed so you only have one dimension that can be sorted by the 'Y' value.
Hope this helps.
Mike