Unlock a world of possibilities! Login now and discover the exclusive benefits awaiting you.
- Qlik Community
- :
- All Forums
- :
- QlikView App Dev
- :
- Re: Sorting Order
- Subscribe to RSS Feed
- Mark Topic as New
- Mark Topic as Read
- Float this Topic for Current User
- Bookmark
- Subscribe
- Mute
- Printer Friendly Page
- Mark as New
- Bookmark
- Subscribe
- Mute
- Subscribe to RSS Feed
- Permalink
- Report Inappropriate Content
Sorting Order
Hi Friends
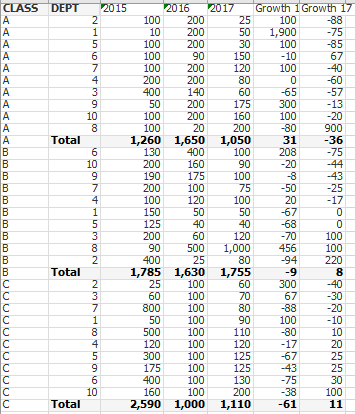
I have created a pivot table in my QV document which is attached herewit. In my pivot tbale I want to sort Dept based on growth rate of 2017. However though Department are sorted in correct way against Dept 'A' other two dept take a different order. Kidnly help me to sort out this issue. My correct table should look like shown below.
- « Previous Replies
-
- 1
- 2
- Next Replies »
- Mark as New
- Bookmark
- Subscribe
- Mute
- Subscribe to RSS Feed
- Permalink
- Report Inappropriate Content
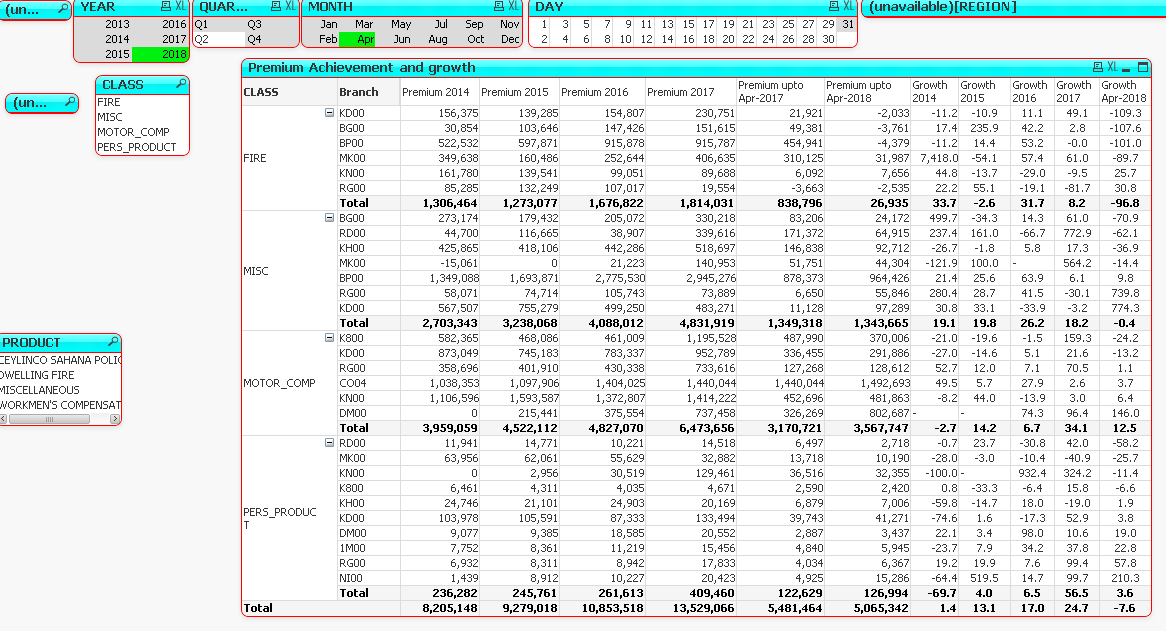
This is my real data. Pls look into this and help me
- Mark as New
- Bookmark
- Subscribe
- Mute
- Subscribe to RSS Feed
- Permalink
- Report Inappropriate Content
Is this what you want? No more nulls?
- Mark as New
- Bookmark
- Subscribe
- Mute
- Subscribe to RSS Feed
- Permalink
- Report Inappropriate Content
Thanks Sunny,
This is not excatly I want. Whne you view the pivot table without selecting month there no null values. all values are associated with a Branch. Only when I select amonth the problem comes. What I want is to not to have any null value when I select a month without supressing Zero Values. Pls help
- Mark as New
- Bookmark
- Subscribe
- Mute
- Subscribe to RSS Feed
- Permalink
- Report Inappropriate Content
Try this
=Aggr(Dual(Only({<MONTH, YEAR>}BCOD),
RangeSum(
Rank((SUM({<YEAR={"$(=MAX([YEAR])-1)"}, MONTH>}PREMIUM)
-SUM({<YEAR={"$(=MAX([YEAR])-2)"}, MONTH>}PREMIUM))
/SUM({<YEAR={"$(=MAX([YEAR])-2)"}, MONTH>}PREMIUM)*100),
Rank(SUM({<YEAR={"$(=MAX([YEAR])-1)"}, MONTH>}PREMIUM))/1E7,
Only({<MONTH, YEAR>}Aggr(NODISTINCT Rank(Only({<MONTH, YEAR>}CLASS)), CLASS)) *1000000)
), CLASS, BCOD)
- Mark as New
- Bookmark
- Subscribe
- Mute
- Subscribe to RSS Feed
- Permalink
- Report Inappropriate Content
Thanks Sunny.
It is perfect and works fine though It is difficult for me to undestand.
- « Previous Replies
-
- 1
- 2
- Next Replies »