Unlock a world of possibilities! Login now and discover the exclusive benefits awaiting you.
- Qlik Community
- :
- All Forums
- :
- QlikView App Dev
- :
- Sorting Order
- Subscribe to RSS Feed
- Mark Topic as New
- Mark Topic as Read
- Float this Topic for Current User
- Bookmark
- Subscribe
- Mute
- Printer Friendly Page
- Mark as New
- Bookmark
- Subscribe
- Mute
- Subscribe to RSS Feed
- Permalink
- Report Inappropriate Content
Sorting Order
Hi Friends
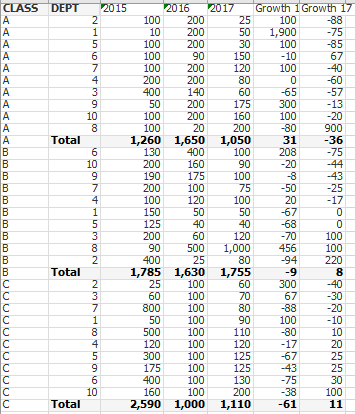
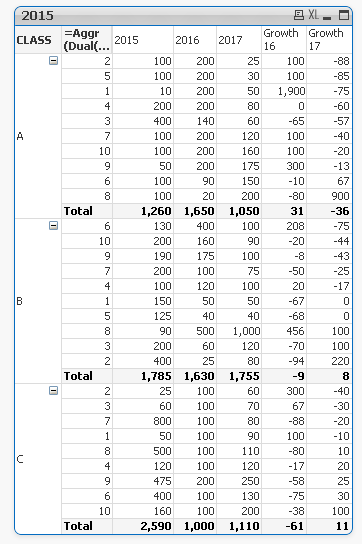
I have created a pivot table in my QV document which is attached herewit. In my pivot tbale I want to sort Dept based on growth rate of 2017. However though Department are sorted in correct way against Dept 'A' other two dept take a different order. Kidnly help me to sort out this issue. My correct table should look like shown below.
- « Previous Replies
-
- 1
- 2
- Next Replies »
Accepted Solutions
- Mark as New
- Bookmark
- Subscribe
- Mute
- Subscribe to RSS Feed
- Permalink
- Report Inappropriate Content
Try this
=Aggr(Dual(Only({<MONTH, YEAR>}BCOD),
RangeSum(
Rank((SUM({<YEAR={"$(=MAX([YEAR])-1)"}, MONTH>}PREMIUM)
-SUM({<YEAR={"$(=MAX([YEAR])-2)"}, MONTH>}PREMIUM))
/SUM({<YEAR={"$(=MAX([YEAR])-2)"}, MONTH>}PREMIUM)*100),
Rank(SUM({<YEAR={"$(=MAX([YEAR])-1)"}, MONTH>}PREMIUM))/1E7,
Only({<MONTH, YEAR>}Aggr(NODISTINCT Rank(Only({<MONTH, YEAR>}CLASS)), CLASS)) *1000000)
), CLASS, BCOD)
- Mark as New
- Bookmark
- Subscribe
- Mute
- Subscribe to RSS Feed
- Permalink
- Report Inappropriate Content
Is this what you wanted
Use the following calculated dimension instead of using DEPT as your dimension
=Aggr(Dual(DEPT,
Rank((SUM({<YEAR={"$(=MAX([YEAR]))"}>}AMOUNT)
-SUM({<YEAR={"$(=MAX([YEAR])-1)"}>}AMOUNT))
/SUM({<YEAR={"$(=MAX([YEAR])-1)"}>}AMOUNT)*100)
+
Rank(SUM({<YEAR={"$(=MAX([YEAR]))"}>}AMOUNT))/1E10
+
Aggr(NODISTINCT Rank(CLASS), CLASS) *10000), CLASS, DEPT)
- Mark as New
- Bookmark
- Subscribe
- Mute
- Subscribe to RSS Feed
- Permalink
- Report Inappropriate Content
Thanks Sunny,
It works . But I do not understand division by /1E10. Pls explain. The other issue is I have more than 10 DEPT in my real data.
- Mark as New
- Bookmark
- Subscribe
- Mute
- Subscribe to RSS Feed
- Permalink
- Report Inappropriate Content
1) 1E10 = 10,000,000,000 -> I am dividing Rank(SUM({<YEAR={"$(=MAX([YEAR]))"}>}AMOUNT)) by that number
2) You have 10 DEPT? So, what is the problem with that?
- Mark as New
- Bookmark
- Subscribe
- Mute
- Subscribe to RSS Feed
- Permalink
- Report Inappropriate Content
Thanks Sunny
But in my real data I get row od data without a branch as shown below
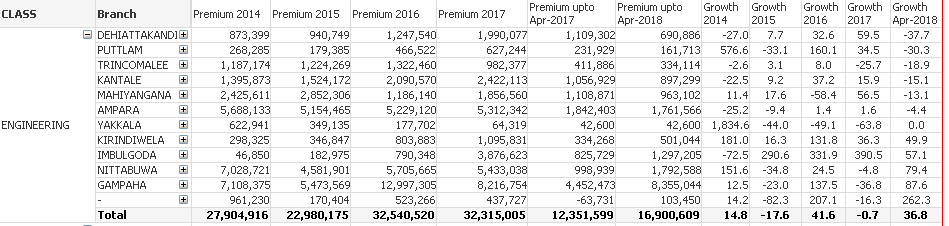
That Last row has no branch . What could be the reason Sunny please ?
- Mark as New
- Bookmark
- Subscribe
- Mute
- Subscribe to RSS Feed
- Permalink
- Report Inappropriate Content
I am not sure... is that a needed row or do you not want to see it?
- Mark as New
- Bookmark
- Subscribe
- Mute
- Subscribe to RSS Feed
- Permalink
- Report Inappropriate Content
That is not needed . when I select a month in my list box I get this blank row. In fact my expression is coupled with month in my real data.
Sum( {$<YEAR ={"$(=MAX([YEAR]))"},MONTH={"<=$(=max(MONTH))"}>}[PREMIUM] )
Is it due to that ?
- Mark as New
- Bookmark
- Subscribe
- Mute
- Subscribe to RSS Feed
- Permalink
- Report Inappropriate Content
coupled? Not sure I understand....
In order to hide the null row, just select 'Suppress When Value is Null' for the second dimensions
- Mark as New
- Bookmark
- Subscribe
- Mute
- Subscribe to RSS Feed
- Permalink
- Report Inappropriate Content
No Friend I will send sample of my real data. So that you can have a look please
- Mark as New
- Bookmark
- Subscribe
- Mute
- Subscribe to RSS Feed
- Permalink
- Report Inappropriate Content
okay
- « Previous Replies
-
- 1
- 2
- Next Replies »