Unlock a world of possibilities! Login now and discover the exclusive benefits awaiting you.
- Qlik Community
- :
- All Forums
- :
- QlikView App Dev
- :
- Re: Sparkline Trending Issue - Example QVW Include...
- Subscribe to RSS Feed
- Mark Topic as New
- Mark Topic as Read
- Float this Topic for Current User
- Bookmark
- Subscribe
- Mute
- Printer Friendly Page
- Mark as New
- Bookmark
- Subscribe
- Mute
- Subscribe to RSS Feed
- Permalink
- Report Inappropriate Content
Sparkline Trending Issue - Example QVW Included
Hi All,
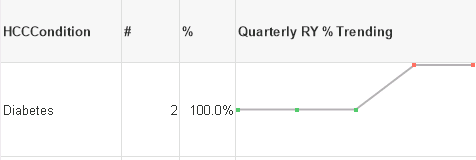
The expression that I'm using for sparklines is incorrectly drawing the sparkline column of the table. When the numerator and denominator of this same expression is calculated using hardcoded dates in other columns of the table, these columns are correctly calculated.
See attached example for HCC Diabetes variable - the trend line in the sparkline is incorrectly depicted as follows:
As you'll see by the data in the INLINE load of the script, the correct trendline pattern is displayed by a line chart in the application and should look like this:
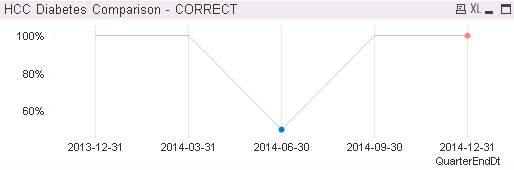
Notice the data is pulled in at 2 levels so that multiple indicators can be displayed on same chart (i.e. multiple chronic conditions). This example application is simplified to only include 2 patients and 2 chronic conditions but the actual application contains many more patients and conditions.
Thanks for the help!
- « Previous Replies
-
- 1
- 2
- Next Replies »
- Mark as New
- Bookmark
- Subscribe
- Mute
- Subscribe to RSS Feed
- Permalink
- Report Inappropriate Content
This results in missing values for all of these columns. I've added this code to the attached file - these columns are not populated. Any minor change I'll need?
Thank you for all of your help!
- Mark as New
- Bookmark
- Subscribe
- Mute
- Subscribe to RSS Feed
- Permalink
- Report Inappropriate Content
Three problems
1) You missed a closing parenthesis for Only() function
Only({<EndDt,QuarterEndDt-={''}>}Aggr(NODISTINCT COUNT({<EndDt,QuarterEndDt-={''}>} DISTINCT KeyPatEnd), QuarterEndDt))
2) You have a variable which is not even created in the sample app... so I guess this is probably not going to be an issue for you
vDimensionConditionTrends is not available
3) If there are more than one month with Max/Min value, what would you want to show? Randomly any? If Random is good, add DISTINCT after FirstSortedValue.
- Mark as New
- Bookmark
- Subscribe
- Mute
- Subscribe to RSS Feed
- Permalink
- Report Inappropriate Content
Ahhh! Good catches! See my responses and fixes below!
1) You missed a closing parenthesis for Only() function - DONE!
Only({<EndDt,QuarterEndDt-={''}>}Aggr(NODISTINCT COUNT({<EndDt,QuarterEndDt-={''}>} DISTINCT KeyPatEnd), QuarterEndDt))
2) You have a variable which is not even created in the sample app... so I guess this is probably not going to be an issue for you - Updated the sample app to use the appropriate field for the dummied data!
vDimensionConditionTrends is not available
3) If there are more than one month with Max/Min value, what would you want to show? Randomly any? If Random is good, add DISTINCT after FirstSortedValue. - I would like to show the most recent date when there is more than one month with the min or max... how would I do this? See attached _v4.
- Mark as New
- Bookmark
- Subscribe
- Mute
- Subscribe to RSS Feed
- Permalink
- Report Inappropriate Content
Check now
- Mark as New
- Bookmark
- Subscribe
- Mute
- Subscribe to RSS Feed
- Permalink
- Report Inappropriate Content
This is perfect! Thank you!!!
- « Previous Replies
-
- 1
- 2
- Next Replies »