Unlock a world of possibilities! Login now and discover the exclusive benefits awaiting you.
- Qlik Community
- :
- All Forums
- :
- QlikView App Dev
- :
- Re: Sparkline in a Pivot Chart
- Subscribe to RSS Feed
- Mark Topic as New
- Mark Topic as Read
- Float this Topic for Current User
- Bookmark
- Subscribe
- Mute
- Printer Friendly Page
- Mark as New
- Bookmark
- Subscribe
- Mute
- Subscribe to RSS Feed
- Permalink
- Report Inappropriate Content
Sparkline in a Pivot Chart
Hi all,
A quick question, do you know if we can create a sparkline in a pivot table, similar to the below.

We currently have 4 Dimensions in the pivot, with the date in columns. (The date is a Dimension)
The Expression = the sum of activity for each date in the format Month Year.
I know that this is possible using the Chart Properties - Chart Type - Straight table, because we have the MiniChart Representation under Expressions. However with the straight table we can not customise properly or group like Product Name.

Thank you so much for reading ![]()
- « Previous Replies
-
- 1
- 2
- Next Replies »
- Mark as New
- Bookmark
- Subscribe
- Mute
- Subscribe to RSS Feed
- Permalink
- Report Inappropriate Content
can you post some sample data
If a post helps to resolve your issue, please accept it as a Solution.
- Mark as New
- Bookmark
- Subscribe
- Mute
- Subscribe to RSS Feed
- Permalink
- Report Inappropriate Content
I don't think so whether we can achieve this in Pivot Table. But, We can do in Straight Table. What was the problem to do in Straight Table
From below, If we want to remove Square rackets that we can do
- Mark as New
- Bookmark
- Subscribe
- Mute
- Subscribe to RSS Feed
- Permalink
- Report Inappropriate Content
Hello Mary,
Trust that you are doing well!
As per my knowledge, Mini Charts option is only available in the Expressions page of a straight table's Properties dialog (refer - Mini chart settings ‒ QlikView).
However, you can make use Linear Gauge chart (if it suits your requirement).
Regards!
Rahul
- Mark as New
- Bookmark
- Subscribe
- Mute
- Subscribe to RSS Feed
- Permalink
- Report Inappropriate Content
Hi yes u can.
Click on minichart,,go to mini chart properties select dimension.
Attach file if u facing problem..:)
Sachin
- Mark as New
- Bookmark
- Subscribe
- Mute
- Subscribe to RSS Feed
- Permalink
- Report Inappropriate Content
I don't think Pivot can have this Settings ![]()
- Mark as New
- Bookmark
- Subscribe
- Mute
- Subscribe to RSS Feed
- Permalink
- Report Inappropriate Content
Thanks for the prompt reply Vineeth ![]() .
.
Below is some sample data.
- Mark as New
- Bookmark
- Subscribe
- Mute
- Subscribe to RSS Feed
- Permalink
- Report Inappropriate Content
Thanks Anil.
We want to have something similar to the below:

I dont think it is possible to achieve this using a straight table.
- Mark as New
- Bookmark
- Subscribe
- Mute
- Subscribe to RSS Feed
- Permalink
- Report Inappropriate Content
Thanks for the reply Sachin.
I have attached the sample file below.
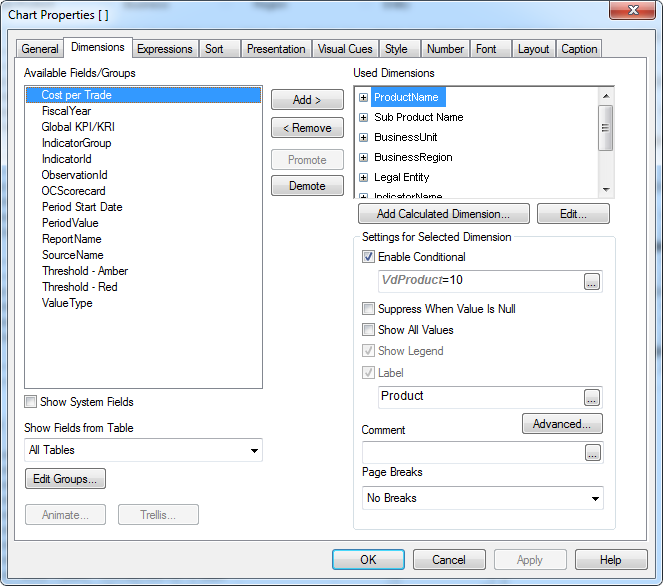
I can not find the "Mini chart" properties under dimensions ![]()

- Mark as New
- Bookmark
- Subscribe
- Mute
- Subscribe to RSS Feed
- Permalink
- Report Inappropriate Content
Use Generic Load for cross like months and then create Straight Table
For more information on Generic follow this Use cases for Generic Load | Qlikview Cookbook
- « Previous Replies
-
- 1
- 2
- Next Replies »