Unlock a world of possibilities! Login now and discover the exclusive benefits awaiting you.
- Qlik Community
- :
- All Forums
- :
- QlikView App Dev
- :
- Re: Split a string into distinct substrings
- Subscribe to RSS Feed
- Mark Topic as New
- Mark Topic as Read
- Float this Topic for Current User
- Bookmark
- Subscribe
- Mute
- Printer Friendly Page
- Mark as New
- Bookmark
- Subscribe
- Mute
- Subscribe to RSS Feed
- Permalink
- Report Inappropriate Content
Split a string into distinct substrings
Hi there,
In my app I have a list of trucks that are stored in a field as one large string e.g.
TA250,TA300,TA400 etc.
The reason it is stored like this is because the front application it pulls the data from, has check boxes for each truck, so when you check a check box next to the truck, it adds the truck name onto the string.
I want to be able to split this string into separate strings so I can measure data based on each truck i.e. in a bar graph.
I have tried using the substring function and then an inline table but the issue I have with that is that the order the trucks are saved in, in the string is never the same.
E.g. if you had 5 trucks and you only select 3 of them, then the will be pushed to position1, position2, and position3.
I want them to stay in each section so each section is distinct.
Can anyone help?
I'm using Qlik Sense web.
- Tags:
- multiple
- sub string
Accepted Solutions
- Mark as New
- Bookmark
- Subscribe
- Mute
- Subscribe to RSS Feed
- Permalink
- Report Inappropriate Content
I would do the split into substrings in the script, using SubField() function.
Something like
LOAD *, AutoNumber(RowNo(), RecID) as TruckID;
LOAD Recno() as RecID, Subfield(Trucks,',') as Truck
INLINE [
Trucks
"TA250,TA300,TA400"
"TA500,TA350,TA410, T7000"
];
- Mark as New
- Bookmark
- Subscribe
- Mute
- Subscribe to RSS Feed
- Permalink
- Report Inappropriate Content
Hi Swuehl,
Thanks for your comment.
I do already have a similar function, I'll show you what I have:
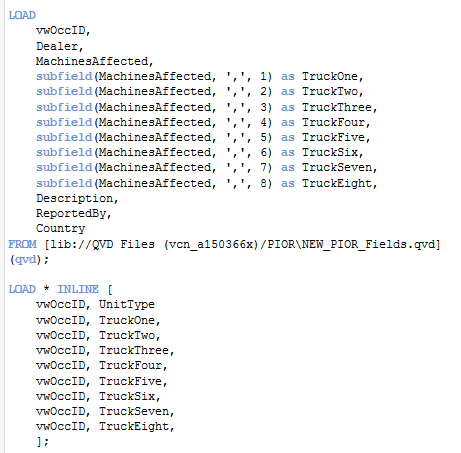
Would your solution however offer the opportunity to do a distinct count of each individual truck?
I want to know how many times each truck occurs and can't count e.g. TruckOne as TA250, as it may store it as TA300, if TA250 wasn't ticked
Thanks
- Mark as New
- Bookmark
- Subscribe
- Mute
- Subscribe to RSS Feed
- Permalink
- Report Inappropriate Content
I found a solution, let me know what you think and if you think it looks good I'll mark it as correct.
Thanks.
LOAD
vwOccID,
Dealer,
MachinesAffected,
if(WildMatch(MachinesAffected, '*TA250*'), 1, 0) as numTA250,
if(WildMatch(MachinesAffected, '*TA300*'), 1, 0) as numTA300,
if(WildMatch(MachinesAffected, '*TA400*'), 1, 0) as numTA400,
if(WildMatch(MachinesAffected, '*TR35*'), 1, 0) as numTR35,
if(WildMatch(MachinesAffected, '*TR45*'), 1, 0) as numTR45,
if(WildMatch(MachinesAffected, '*TR60*'), 1, 0) as numTR60,
if(WildMatch(MachinesAffected, '*TR70*'), 1, 0) as numTR70,
if(WildMatch(MachinesAffected, '*TR100*'), 1, 0) as numTR100,
//if(WildMatch(MachinesAffected, '*RH95*'), 1, 0) as numRH95,
Description,
ReportedBy,
Country
FROM [lib://QVD Files (vcn_a150366x)/PIOR\NEW_PIOR_Fields.qvd]
(qvd);
I then did a Sum(numTA250) etc as the measures in the bar graph!
Ideally I wanted a pie chart but this should do.
- Mark as New
- Bookmark
- Subscribe
- Mute
- Subscribe to RSS Feed
- Permalink
- Report Inappropriate Content
I don't really understand your last sentence. Could you maybe explain with some sample data?
If you want to distinct count the first, second etc. truck, you can use TruckID in my sample model:
=Count({<TruckID = {1}>} DISTINCT Truck)
- Mark as New
- Bookmark
- Subscribe
- Mute
- Subscribe to RSS Feed
- Permalink
- Report Inappropriate Content
You probably can do it like this, but it look rather static with creating a flag field per Truck value.
Why not create a record per Truck per input line as shown in my previous post and then use Truck as dimension and
=Count(DISTINCT RecID)
as expression? Why do you want to hard code the available truck names in your expressions?
- Mark as New
- Bookmark
- Subscribe
- Mute
- Subscribe to RSS Feed
- Permalink
- Report Inappropriate Content
My apologies, I just realized the mistake I was making.
I now get what you mean - here is the code I used that now works as you suggested:
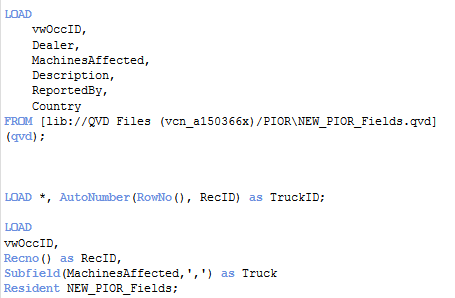
Let me know what you think. Thanks.
- Mark as New
- Bookmark
- Subscribe
- Mute
- Subscribe to RSS Feed
- Permalink
- Report Inappropriate Content
Looks ok to me, does it work as expected?
- Mark as New
- Bookmark
- Subscribe
- Mute
- Subscribe to RSS Feed
- Permalink
- Report Inappropriate Content
Works perfectly thank you!