Unlock a world of possibilities! Login now and discover the exclusive benefits awaiting you.
- Qlik Community
- :
- All Forums
- :
- QlikView App Dev
- :
- Re: Stack graph with bigger value at bottom
- Subscribe to RSS Feed
- Mark Topic as New
- Mark Topic as Read
- Float this Topic for Current User
- Bookmark
- Subscribe
- Mute
- Printer Friendly Page
- Mark as New
- Bookmark
- Subscribe
- Mute
- Subscribe to RSS Feed
- Permalink
- Report Inappropriate Content
Stack graph with bigger value at bottom
Hi,
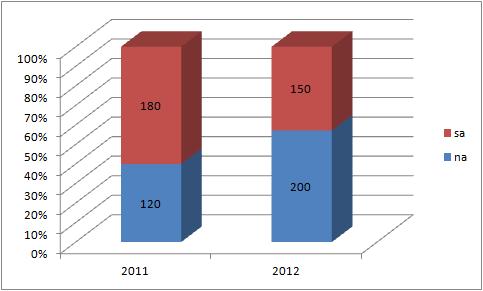
I have following table and graph...now the manager wants the graph to be changed...currently the graph is showing all NA value in bottom of the stack and SA values at the top of the stack. The manager now wants the highest value to be at the bottom of the stock. So for year 2011 value 180 of SA should be displayed at bottom...and for year 2012 value 200 of NA should be shown at bottom. Any guidance?
| 2011 | 2012 | |
| na | 120 | 200 |
| sa | 180 | 150 |
Accepted Solutions
- Mark as New
- Bookmark
- Subscribe
- Mute
- Subscribe to RSS Feed
- Permalink
- Report Inappropriate Content
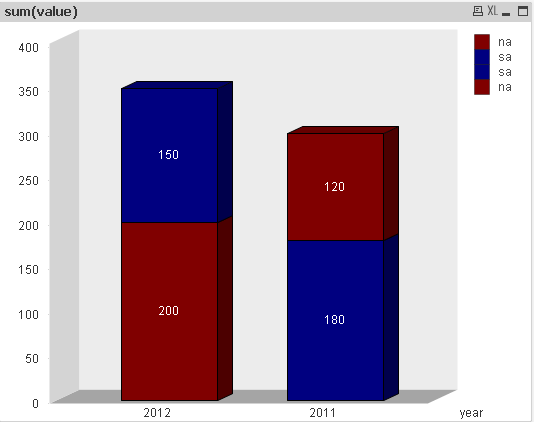
Ok I've a workaround to achieve this but needs little more work to align the location (sa and na) in the chart legend.
Or you can simply hide the legends for calc dimension and can use a dynamic text as legend.
Please take a look at the example attached.
- Mark as New
- Bookmark
- Subscribe
- Mute
- Subscribe to RSS Feed
- Permalink
- Report Inappropriate Content
That would change the order of the expression and maybe end user gets confused as the legends order will change. I'm not still sure if that is doable. You can sort based on Y value Asc or Dsc for each year.
- Mark as New
- Bookmark
- Subscribe
- Mute
- Subscribe to RSS Feed
- Permalink
- Report Inappropriate Content
Thanks Sudeep for quick response.
I agree that the user is likely to get confused, but that's a user request 
Sorting Y axis isn't possible with given data as it has 2 rows/columns that needs to be sorted. Both of them cannot be sorted simultaniously.
- Mark as New
- Bookmark
- Subscribe
- Mute
- Subscribe to RSS Feed
- Permalink
- Report Inappropriate Content
Ok I've a workaround to achieve this but needs little more work to align the location (sa and na) in the chart legend.
Or you can simply hide the legends for calc dimension and can use a dynamic text as legend.
Please take a look at the example attached.
- Mark as New
- Bookmark
- Subscribe
- Mute
- Subscribe to RSS Feed
- Permalink
- Report Inappropriate Content
Thanksa Sudeep, your answer provides the solution to a large extend.
By any chance did you get chance to check legend issue? For now work around I am following is to have manually added legends.
- Mark as New
- Bookmark
- Subscribe
- Mute
- Subscribe to RSS Feed
- Permalink
- Report Inappropriate Content
Hi Pravin,
Change the expressions using promte and denote on chart properties , I guess it works and need to change littel bit expression as well.
Regards
Sunil