Unlock a world of possibilities! Login now and discover the exclusive benefits awaiting you.
- Qlik Community
- :
- All Forums
- :
- QlikView App Dev
- :
- Re: Stacked Bar Chart Labels Positioning
- Subscribe to RSS Feed
- Mark Topic as New
- Mark Topic as Read
- Float this Topic for Current User
- Bookmark
- Subscribe
- Mute
- Printer Friendly Page
- Mark as New
- Bookmark
- Subscribe
- Mute
- Subscribe to RSS Feed
- Permalink
- Report Inappropriate Content
Stacked Bar Chart Labels Positioning
Hi there..
I need help with defining the presentation & positioning of a stacked bar chart.
the bar chart I'm working on is attached. at the moment i know to add the data points, as shown in the picture attached.
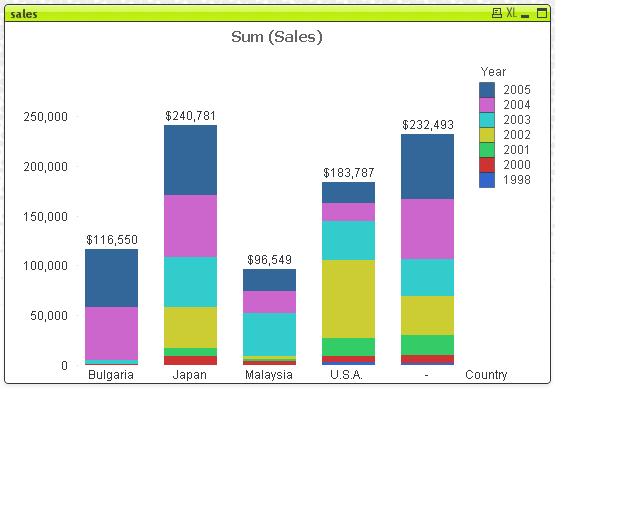
The question is how do i add summarizing labels to the different sections on every bar? in the picture above i would like to show for example the sum of sales for bulgaria for each year, and on the bar.
Furthermore, how do i set the position of such label? above the section, below the section etc..
I would appreciate your help.. 
- Mark as New
- Bookmark
- Subscribe
- Mute
- Subscribe to RSS Feed
- Permalink
- Report Inappropriate Content
Hi,
Try this. Go to Presentation tab, enable Plot value inside the graph.
Deepak
- Mark as New
- Bookmark
- Subscribe
- Mute
- Subscribe to RSS Feed
- Permalink
- Report Inappropriate Content
Thanks a lot Deepak and PariPari!
it was very helpful.
all i need now is to know how to change the position of such labels, as i stated before - above\below the different segments..
evya