Unlock a world of possibilities! Login now and discover the exclusive benefits awaiting you.
- Qlik Community
- :
- All Forums
- :
- QlikView App Dev
- :
- Re: Stacked Bar Chart with Line
Options
- Subscribe to RSS Feed
- Mark Topic as New
- Mark Topic as Read
- Float this Topic for Current User
- Bookmark
- Subscribe
- Mute
- Printer Friendly Page
Turn on suggestions
Auto-suggest helps you quickly narrow down your search results by suggesting possible matches as you type.
Showing results for
Partner - Specialist II
2016-07-15
03:06 AM
- Mark as New
- Bookmark
- Subscribe
- Mute
- Subscribe to RSS Feed
- Permalink
- Report Inappropriate Content
Stacked Bar Chart with Line
Hi Friends,
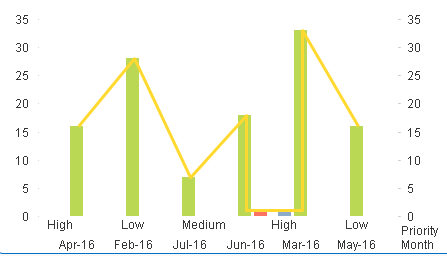
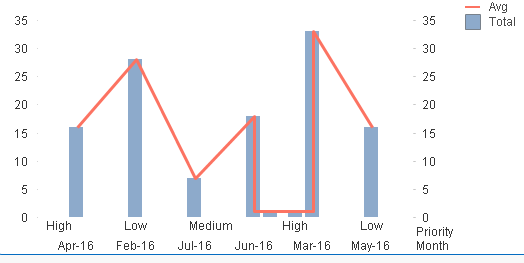
I have one requirement, in which i am displaying stacked bar chart for 2 dimensions. Now user wants to add Line to show the trend of same data. How should we achieve ?
Attached the expected output
5,410 Views
- « Previous Replies
-
- 1
- 2
- Next Replies »
13 Replies
2016-07-15
05:09 AM
- Mark as New
- Bookmark
- Subscribe
- Mute
- Subscribe to RSS Feed
- Permalink
- Report Inappropriate Content
I taken the Daniel Chart. Here, i take 2 Dim
Like this
OR
Best Anil, When applicable please mark the correct/appropriate replies as "solution" (you can mark up to 3 "solutions". Please LIKE threads if the provided solution is helpful
599 Views
Partner - Specialist II
2016-07-15
05:09 AM
Author
- Mark as New
- Bookmark
- Subscribe
- Mute
- Subscribe to RSS Feed
- Permalink
- Report Inappropriate Content
Thanks for your reply. As mentioned, priority data may change or new values might get added. Then this will not work
599 Views
Partner - Specialist II
2016-07-15
05:12 AM
Author
- Mark as New
- Bookmark
- Subscribe
- Mute
- Subscribe to RSS Feed
- Permalink
- Report Inappropriate Content
Thanks Ruben, This is good idea but is workaround. If something possible in single chart itself then it would be great
599 Views
Creator III
2017-08-24
07:58 AM
- Mark as New
- Bookmark
- Subscribe
- Mute
- Subscribe to RSS Feed
- Permalink
- Report Inappropriate Content
Can we get the same logic in 100% Stacked combo chart ? Below is the example.. Now i need to drew line at 75% & 90%..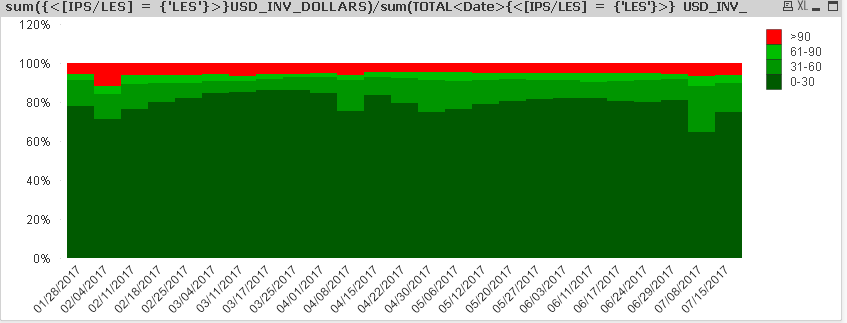
599 Views
- « Previous Replies
-
- 1
- 2
- Next Replies »