Unlock a world of possibilities! Login now and discover the exclusive benefits awaiting you.
- Qlik Community
- :
- All Forums
- :
- QlikView App Dev
- :
- Re: Stacked Bar to Linear Gauge Ruler Chart
- Subscribe to RSS Feed
- Mark Topic as New
- Mark Topic as Read
- Float this Topic for Current User
- Bookmark
- Subscribe
- Mute
- Printer Friendly Page
- Mark as New
- Bookmark
- Subscribe
- Mute
- Subscribe to RSS Feed
- Permalink
- Report Inappropriate Content
Stacked Bar to Linear Gauge Ruler Chart
Hi Friends,
I need your help here.
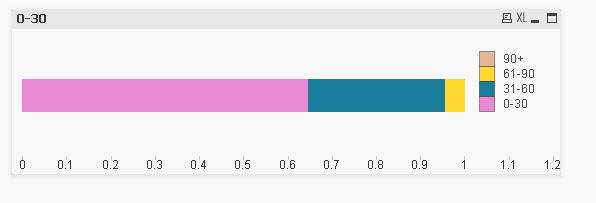
On the image shown above, i have created a stacked bar chart.
I need to make a linear gauge chart ruler similar to this.
Is this possible in qlikview?
I did try making a gauge chart but it was not coming with the desired results.
Thanks in advance.
Regards,
Kuldeep
- « Previous Replies
-
- 1
- 2
- Next Replies »
- Mark as New
- Bookmark
- Subscribe
- Mute
- Subscribe to RSS Feed
- Permalink
- Report Inappropriate Content
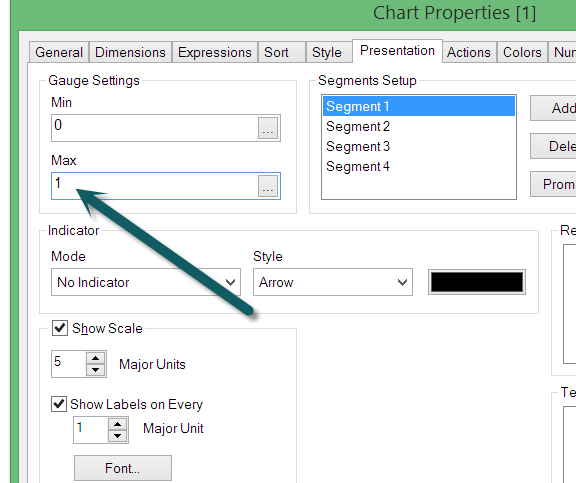
You should store each expression in the right variable..
v0_30=Count({<[Age] = {'0-30'}>}[Age])/Count([Age])
v31_60=Count({<[Age] = {'31-60'}>}[Age])/Count([Age])
....
You also need to change the max of the gauge, with the sum of all the expressions v0_30+v31_60+...
Regards,
- Mark as New
- Bookmark
- Subscribe
- Mute
- Subscribe to RSS Feed
- Permalink
- Report Inappropriate Content
Hey David,
This is what exactly i did. But was not getting the results.
Regards,
Kuldeep
- Mark as New
- Bookmark
- Subscribe
- Mute
- Subscribe to RSS Feed
- Permalink
- Report Inappropriate Content
Could you provide the file with an example of what you're using?
- Mark as New
- Bookmark
- Subscribe
- Mute
- Subscribe to RSS Feed
- Permalink
- Report Inappropriate Content
Hi David,
Attached file for your reference.
Regards.
Kuldeep
- Mark as New
- Bookmark
- Subscribe
- Mute
- Subscribe to RSS Feed
- Permalink
- Report Inappropriate Content
You missed the '=', in the variable, so you were storing text, no the value of the expression (you could also use the $(expression) to calculate it)
=Count({<[Age] = {'0-30'}>}[Age])/Count([Age])
I attach you the file with this issue fixed
Kind regards,
- Mark as New
- Bookmark
- Subscribe
- Mute
- Subscribe to RSS Feed
- Permalink
- Report Inappropriate Content
Thanks David.
This is perfect. Exactly what i need 
Regards,
Kuldeep
- « Previous Replies
-
- 1
- 2
- Next Replies »