Unlock a world of possibilities! Login now and discover the exclusive benefits awaiting you.
- Qlik Community
- :
- All Forums
- :
- QlikView App Dev
- :
- Re: Stacked Bars with Values Displayed On Data Poi...
- Subscribe to RSS Feed
- Mark Topic as New
- Mark Topic as Read
- Float this Topic for Current User
- Bookmark
- Subscribe
- Mute
- Printer Friendly Page
- Mark as New
- Bookmark
- Subscribe
- Mute
- Subscribe to RSS Feed
- Permalink
- Report Inappropriate Content
Stacked Bars with Values Displayed On Data Points
Hello Everyone,
I've looked through many posts regarding stacked bars. I've managed to find semi solution but, still it is not what I want to have.
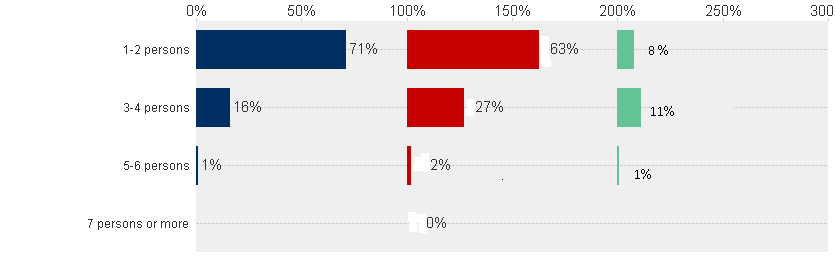
This is an image of what I'm trying to create:
Problematic is the part of showing values on data points.
My thinking is to do it in one chart (bar or combo).
Please, help me to figure out the proper solution.
Kind regards,
Janusz
- « Previous Replies
-
- 1
- 2
- Next Replies »
- Mark as New
- Bookmark
- Subscribe
- Mute
- Subscribe to RSS Feed
- Permalink
- Report Inappropriate Content
Hi All,
I know that today is friday, but I really need to know if this can be done in one chart?
Please, I need your help.
Many Thanks,
Janusz
- Mark as New
- Bookmark
- Subscribe
- Mute
- Subscribe to RSS Feed
- Permalink
- Report Inappropriate Content
hi,
this is the max i can do...
C u,
Stefano.
- Mark as New
- Bookmark
- Subscribe
- Mute
- Subscribe to RSS Feed
- Permalink
- Report Inappropriate Content
Hi Stefano,
Once again I would like to thank you very much.
This works perfect for bigger values. I don't really know why QlikTech forgot about such a simple functionality as showing values on data point when bars are in the stacked mode?
Why QlikTech? Please, tell me why?
Many Thanks,
Janusz
- Mark as New
- Bookmark
- Subscribe
- Mute
- Subscribe to RSS Feed
- Permalink
- Report Inappropriate Content
I think your frustration may be in trying to approach this as "stacked" chart. It is not a traditional stacked chart.. In a stacked chart all bars must be contiguous so you can accuratly represent the combined height.
What you are show is three charts that share a common dimension. Can you just make three charts? Or am I misundertanding the meaning of this visualization?
-Rob
- Mark as New
- Bookmark
- Subscribe
- Mute
- Subscribe to RSS Feed
- Permalink
- Report Inappropriate Content
Hi Rob,
You are right, I can create three charts to get what I want. The problem appears when you need to show a scroll bar (many dimension values). How to synchronize all charts to follow the scroll bar of the first one? I'm not sure if this is possible. It is a reason why I'm trying to do this in one chart.
Many Thanks,
Janusz
- Mark as New
- Bookmark
- Subscribe
- Mute
- Subscribe to RSS Feed
- Permalink
- Report Inappropriate Content
Hi guys,
if the problem is the scroll bar, u can do something like this.
C u,
Stefano
- Mark as New
- Bookmark
- Subscribe
- Mute
- Subscribe to RSS Feed
- Permalink
- Report Inappropriate Content
Seems like a trellis chart would do the trick, but I don't know how to get an x-axis scrollbar in a trellis chart.
-Rob
- Mark as New
- Bookmark
- Subscribe
- Mute
- Subscribe to RSS Feed
- Permalink
- Report Inappropriate Content
I don't think this can be done in a single chart. 2 Groups could be done using a secondary Axis with "split", but not three.
If the dimension axis can stay static, then overlaying 3 charts is the way to go. If Horisontal Scroll is definitely required, then it's almost impossible to keep things together...
Looks like a candiadate for an Extension object, but then, it might be an overkill in terms of "Cost vs. Benefits".
Sometimes, the answer is "can't be done, sorry!". We need to revisit the requirement and tweak it a bit...
- « Previous Replies
-
- 1
- 2
- Next Replies »