Unlock a world of possibilities! Login now and discover the exclusive benefits awaiting you.
- Qlik Community
- :
- All Forums
- :
- QlikView App Dev
- :
- Re: Stacked Waterfall chart possible in QV?
- Subscribe to RSS Feed
- Mark Topic as New
- Mark Topic as Read
- Float this Topic for Current User
- Bookmark
- Subscribe
- Mute
- Printer Friendly Page
- Mark as New
- Bookmark
- Subscribe
- Mute
- Subscribe to RSS Feed
- Permalink
- Report Inappropriate Content
Stacked Waterfall chart possible in QV?
I am working on a waterfall chart and have it setup such that it can dynamically change to reflect the country or region of choice. What I want to know is if it is possible to make the country or region stack within the waterfall chart in qlikview. I haven't seen a solution to this anywhere.

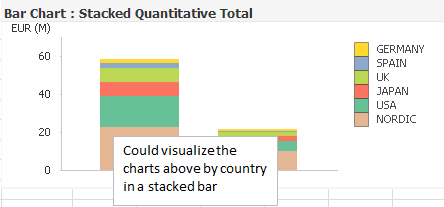
Ideally the solution would allow one to select to see the chart with and without a stack by region or by country.
- Mark as New
- Bookmark
- Subscribe
- Mute
- Subscribe to RSS Feed
- Permalink
- Report Inappropriate Content
Maybe. It's not clear to me what you want. Perhaps something like the example I posted here: http://community.qlik.com/message/451835#451835
talk is cheap, supply exceeds demand
- Mark as New
- Bookmark
- Subscribe
- Mute
- Subscribe to RSS Feed
- Permalink
- Report Inappropriate Content
Thank you for the example. I can see where this type of treatment may work for a limited number of values (such as the regions) and I may have to go that route, but I don’t think that this would be feasible to do with the countries. Ideally I would like to be able to specify the stacked bar to show the largest “X” countries…say 5 and then group the rest so that it is not so unwieldy in it’s presentation. Then perhaps I could take the approach that your example would suggest. Thoughts?