Unlock a world of possibilities! Login now and discover the exclusive benefits awaiting you.
- Qlik Community
- :
- All Forums
- :
- QlikView App Dev
- :
- Re: Stacked bar - data values in segments and tota...
- Subscribe to RSS Feed
- Mark Topic as New
- Mark Topic as Read
- Float this Topic for Current User
- Bookmark
- Subscribe
- Mute
- Printer Friendly Page
- Mark as New
- Bookmark
- Subscribe
- Mute
- Subscribe to RSS Feed
- Permalink
- Report Inappropriate Content
Stacked bar - data values in segments and total
Hi everyone,
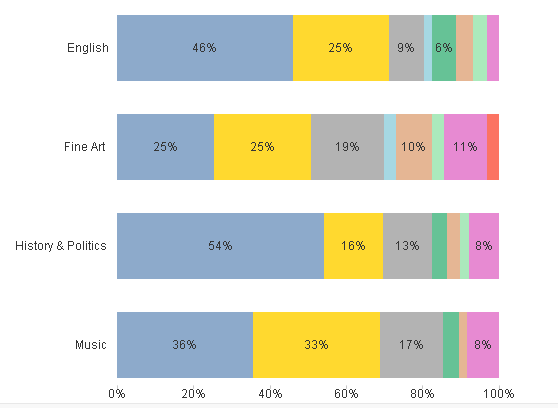
probably a simple one but it has been a long week. I've got a stacked bar chart showing percentages of responses to a question. Each segment has the value shown inside, if the segment is large enough. What I'd like to have is another expression showing the number of respondents to the question. I basically want to see that English had 35 people, Music 120 and so on. I've tried adding another expression and can get it to come up in the pop up but I want to add it to the chart. It looks like you can't have one expression with values inside and one with values outside.
Any ideas would be gratefully received.
thanks
John
- Mark as New
- Bookmark
- Subscribe
- Mute
- Subscribe to RSS Feed
- Permalink
- Report Inappropriate Content
see tis, and don't forgot to check values on data points from expression tab also.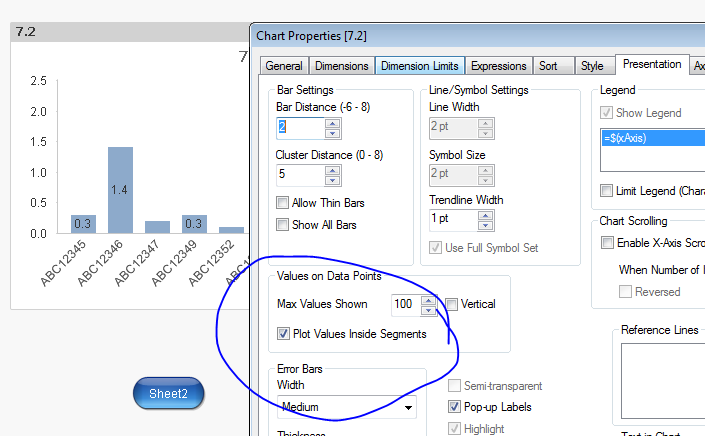
- Mark as New
- Bookmark
- Subscribe
- Mute
- Subscribe to RSS Feed
- Permalink
- Report Inappropriate Content
Check this app
- Mark as New
- Bookmark
- Subscribe
- Mute
- Subscribe to RSS Feed
- Permalink
- Report Inappropriate Content
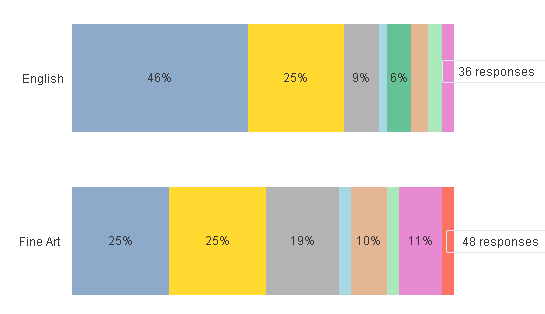
Thanks for your reply Shiva. I know how to get the percentages to plot inside the bars, see my original post, but what I also want is a value outside the bar showing the number of people. In this screenshot I've just created a text object to show what I want but this isn't a final solution as the number of departments will change depending on other filters.
John
- Mark as New
- Bookmark
- Subscribe
- Mute
- Subscribe to RSS Feed
- Permalink
- Report Inappropriate Content
Thanks Anbu,that might be a work around but what I really wanted was a total number for the department, not the number with each answer within the department. Where the segment is small the numbers don't show so my end users can't see how many people answered the question.
John