Unlock a world of possibilities! Login now and discover the exclusive benefits awaiting you.
- Qlik Community
- :
- All Forums
- :
- QlikView App Dev
- :
- Re: Stacked barchart count expression
- Subscribe to RSS Feed
- Mark Topic as New
- Mark Topic as Read
- Float this Topic for Current User
- Bookmark
- Subscribe
- Mute
- Printer Friendly Page
- Mark as New
- Bookmark
- Subscribe
- Mute
- Subscribe to RSS Feed
- Permalink
- Report Inappropriate Content
Stacked barchart count expression
Hi all,
Im newbie i need to get the count like this in stacked bar chart i tried a lot but i can't find the solution.
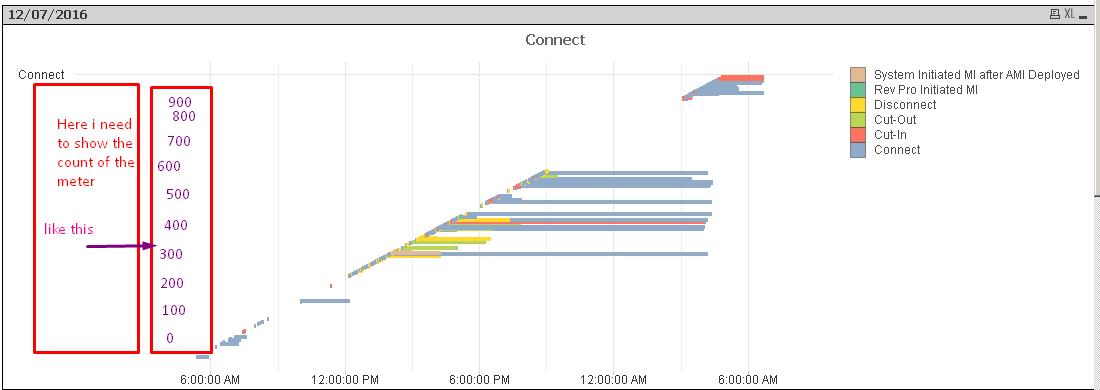
I kept two dimension
1. Execution start time(X-axis)
2. Request type(Y-axis)
In expression i've written this to get the execution time.
=time([Execution Endtime]-[Execution start time])
i know i'm wrong in this expression because i want to show the count so i need to write count expression in set analysis.
by using Field distinct "Command type" .
Help me in this
Thanks in advance.
- Mark as New
- Bookmark
- Subscribe
- Mute
- Subscribe to RSS Feed
- Permalink
- Report Inappropriate Content
What are these 0, 100 --- 900
- Mark as New
- Bookmark
- Subscribe
- Mute
- Subscribe to RSS Feed
- Permalink
- Report Inappropriate Content
I want the counts of the chart.
for example.
Meters count
- Mark as New
- Bookmark
- Subscribe
- Mute
- Subscribe to RSS Feed
- Permalink
- Report Inappropriate Content
that is just an example
- Mark as New
- Bookmark
- Subscribe
- Mute
- Subscribe to RSS Feed
- Permalink
- Report Inappropriate Content
For your posting i didn't find the word Meters. What was that?
- Mark as New
- Bookmark
- Subscribe
- Mute
- Subscribe to RSS Feed
- Permalink
- Report Inappropriate Content
u can see the graph going in ascending order by calculating [Execution End time] and [Execution Start time]
so each id will have some Start time and end time. you can see the graph going step by step so there must be more ID's.
- Mark as New
- Bookmark
- Subscribe
- Mute
- Subscribe to RSS Feed
- Permalink
- Report Inappropriate Content
May be others can help you, Because i am not fully understand on the same. BTW, Community with us they may face same issue earlier