Unlock a world of possibilities! Login now and discover the exclusive benefits awaiting you.
- Qlik Community
- :
- All Forums
- :
- QlikView App Dev
- :
- Stacked column graph showing multiple projects rev...
- Subscribe to RSS Feed
- Mark Topic as New
- Mark Topic as Read
- Float this Topic for Current User
- Bookmark
- Subscribe
- Mute
- Printer Friendly Page
- Mark as New
- Bookmark
- Subscribe
- Mute
- Subscribe to RSS Feed
- Permalink
- Report Inappropriate Content
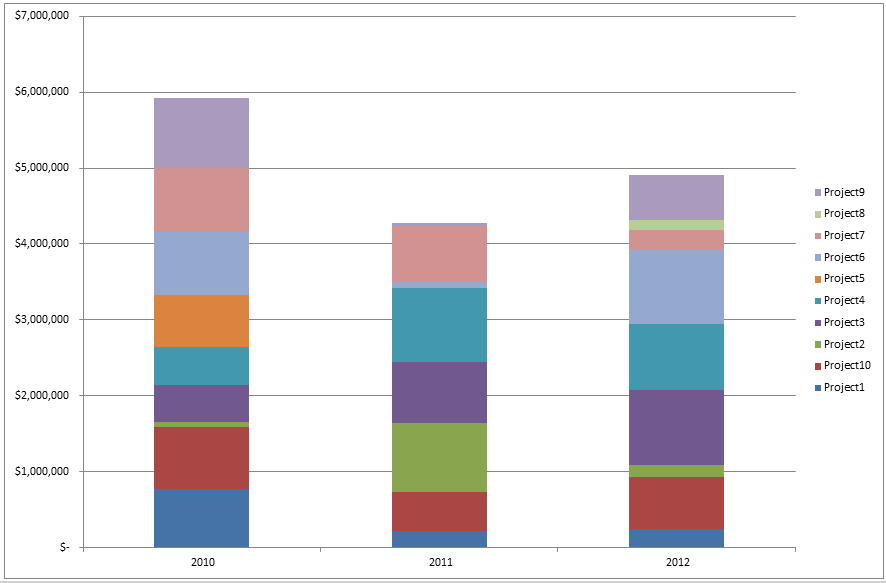
Stacked column graph showing multiple projects revenue, over years
Hi there, I am fairly new to qlikview so excuse me if this seems like a simple question.
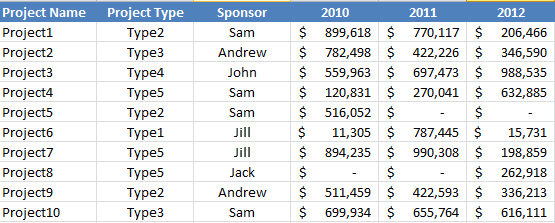
What I have is an excel sheet with column A, showing a couple of hundred project names. In Columns B to L is the revenue of these projects. Column B is the revenue for 2010, column C is the revenue for 2011 and so on.
Below is an example table and the desired result.


How do I go about doing this for all hundred or so projects?
Many thanks for your assistance
Chris
Accepted Solutions
- Mark as New
- Bookmark
- Subscribe
- Mute
- Subscribe to RSS Feed
- Permalink
- Report Inappropriate Content
Dear,
I think you need to load the data as cross table.
Kindly find the attached file.
I hope it will help you.
Thanks,
Mukram.
- Mark as New
- Bookmark
- Subscribe
- Mute
- Subscribe to RSS Feed
- Permalink
- Report Inappropriate Content
Dear,
I think you need to load the data as cross table.
Kindly find the attached file.
I hope it will help you.
Thanks,
Mukram.
- Mark as New
- Bookmark
- Subscribe
- Mute
- Subscribe to RSS Feed
- Permalink
- Report Inappropriate Content
Thank you so much for your quick and accurate response Mohammed. That is exactly what I was after!
With it being my only second day on Qlikview, I was unaware of the existence of cross tables. It will be something I will investigate further going forward.
Kind regards and many thanks again
Chris
- Mark as New
- Bookmark
- Subscribe
- Mute
- Subscribe to RSS Feed
- Permalink
- Report Inappropriate Content
Dear,
you can find many threads on community related to cross table.
below link for one example how to load cross table in qlikview.
Cross Table in Qlikview « Learn Qlikview
Thanks,
Mukram.
- Mark as New
- Bookmark
- Subscribe
- Mute
- Subscribe to RSS Feed
- Permalink
- Report Inappropriate Content
Hi Mohammed,
Sorry to trouble you again but I had a quick follow up question.
Is it possible to include other columns in the cross table that will allow me to filter the graph on?
eg

- Mark as New
- Bookmark
- Subscribe
- Mute
- Subscribe to RSS Feed
- Permalink
- Report Inappropriate Content
Dear chris,
Yes we can add other columns also in cross table.
find the attached file.
I added two new columns project type and sponsor.
Thanks,
Mukram.
- Mark as New
- Bookmark
- Subscribe
- Mute
- Subscribe to RSS Feed
- Permalink
- Report Inappropriate Content
You legend! Thanks again. Looking at your syntax below in the load statement, what does the '3' represent. Is it that I have 3 columns that revenue can be based on; Project Name, Project Type & Sponsor?
CrossTable(Year, Revenue, 3)
LOAD [Projcet Name],
[Project Type],
Sponsor,
[2010],
[2011],
[2012]
FROM
(ooxml, embedded labels, table is Sheet1);