Unlock a world of possibilities! Login now and discover the exclusive benefits awaiting you.
- Qlik Community
- :
- All Forums
- :
- QlikView
- :
- Standard Deviation in Chart (Bell Curve)
- Subscribe to RSS Feed
- Mark Topic as New
- Mark Topic as Read
- Float this Topic for Current User
- Bookmark
- Subscribe
- Mute
- Printer Friendly Page
- Mark as New
- Bookmark
- Subscribe
- Mute
- Subscribe to RSS Feed
- Permalink
- Report Inappropriate Content
Standard Deviation in Chart (Bell Curve)
Hi All,
I have to calculate average and standard deviation of sales count (year wise). attached sample data here.
Could you please assist on this.
Thanks,
Nihhal.
- « Previous Replies
- Next Replies »
- Mark as New
- Bookmark
- Subscribe
- Mute
- Subscribe to RSS Feed
- Permalink
- Report Inappropriate Content
This is not a question about one chart being possible in QlikView or not (in fact you already received examples that demonstrated this particular QlikView visualization, for another one see below).
It simply is not clear how you want to apply this chart to your data.
Please generate your required result using your own sample data (meaning dimension and expression axes should be in terms of your data (years and sales?) instead of being generic like the image you posted).
Your expression "NORMDIST(YEAR, Avg(SALESCOUNT), Stdev(SALESCOUNT),0)" doesn't make much sense to me as it mixes dimensions "year" and "sales".
Maybe you can describe your expectations of this calculation for further clarification?
And again, this is not (yet) a QlikView specific question.
hope this helps
regards
Marco

- Mark as New
- Bookmark
- Subscribe
- Mute
- Subscribe to RSS Feed
- Permalink
- Report Inappropriate Content
Hi Marco, thanks for your response.
Could you please attach qvw?
Actually i want to see dimension and expression (used in above chart) and if you take my sample data, avg should be 175 (not 110).
And i agree with you i have little confusion about standard deviation. As per your chart where can we see standard deviation and how can we recognized? (as avg) this is big challenge for me 🙂
As you said if my requirement is not suitable for standard deviation, can you please share right sample data if possible so i will try to find right way accordingly.
Thank you very much.
- Mark as New
- Bookmark
- Subscribe
- Mute
- Subscribe to RSS Feed
- Permalink
- Report Inappropriate Content
Hi,
I already attached an example in my previous answer.
Leaving out the year dimension you will there get an average of 175.
To visualize the standard deviation you could add reference lines at Avg+Stdev and Avg-Stdev to get a result like this:
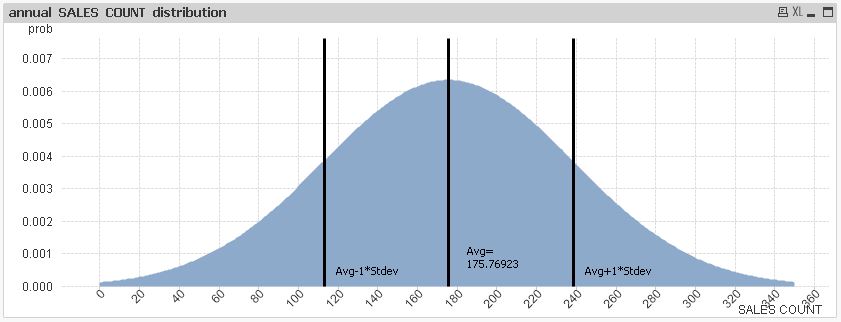
I can't tell whether this chart suits your requirements because you didn't yet clarify how your expected result should look like (besides of it should look like a bell curve).
One of your requirements was a year dimension, yet you wanted to see a maximum at 175 (which surely wouldn't be a year).
So instead of discussing generic visualizations being possible in QlikView or not we should elaborate on your requirements. Me posting some sample data wouldn't be very helpful I guess.
hope this helps
regards
Marco
- « Previous Replies
- Next Replies »