Unlock a world of possibilities! Login now and discover the exclusive benefits awaiting you.
- Qlik Community
- :
- All Forums
- :
- QlikView App Dev
- :
- Re: Static Values of Dimension in Chart
- Subscribe to RSS Feed
- Mark Topic as New
- Mark Topic as Read
- Float this Topic for Current User
- Bookmark
- Subscribe
- Mute
- Printer Friendly Page
- Mark as New
- Bookmark
- Subscribe
- Mute
- Subscribe to RSS Feed
- Permalink
- Report Inappropriate Content
Static Values of Dimension in Chart
Hi
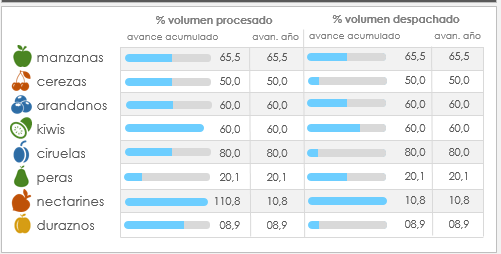
I need to do a graph with static dimensions on a graph. i.e. In the image,
a) I have a lot more dimensions, but I need to show only "Manzanas, Cerezas, Arandanos...."
¿Is it possible?
b) For the same graph, is it possible to mix the "graph" with a table as shown? Or something Similar?
Thanks!!
Accepted Solutions
- Mark as New
- Bookmark
- Subscribe
- Mute
- Subscribe to RSS Feed
- Permalink
- Report Inappropriate Content
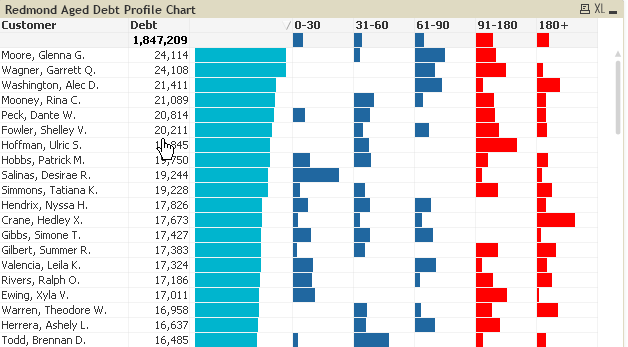
You can look into using the mini chart display option to add e.g. bars to a straight table with numbers:
Mini Bar Chart inside Straight Table and in List Box
You can limit your dimension either using a calculated dimension:
=If(Match(DimensionField, 'manzanas','cerezas'), DimensionField)
or using set analysis in all your aggregations:
=Sum({<DimensionField = { 'manzanas','cerezas'}>} Value)
- Mark as New
- Bookmark
- Subscribe
- Mute
- Subscribe to RSS Feed
- Permalink
- Report Inappropriate Content
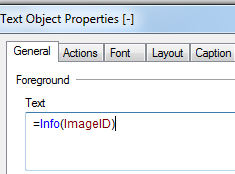
for static value list you can use Valuelist() Function.
You can load image by Bundle load
like
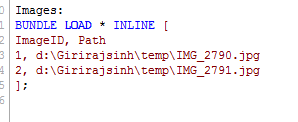
or
for straight table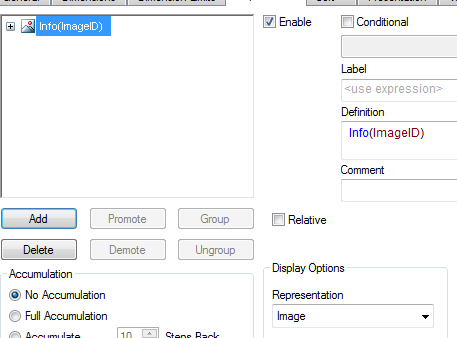
set Representation as Image
- Mark as New
- Bookmark
- Subscribe
- Mute
- Subscribe to RSS Feed
- Permalink
- Report Inappropriate Content
Thanks! Do you know if is it possible to set multi-colors to mini graphs?
- Mark as New
- Bookmark
- Subscribe
- Mute
- Subscribe to RSS Feed
- Permalink
- Report Inappropriate Content