Unlock a world of possibilities! Login now and discover the exclusive benefits awaiting you.
- Qlik Community
- :
- All Forums
- :
- QlikView App Dev
- :
- Step require to show Pie chart Legend in Horizonta...
- Subscribe to RSS Feed
- Mark Topic as New
- Mark Topic as Read
- Float this Topic for Current User
- Bookmark
- Subscribe
- Mute
- Printer Friendly Page
- Mark as New
- Bookmark
- Subscribe
- Mute
- Subscribe to RSS Feed
- Permalink
- Report Inappropriate Content
Step require to show Pie chart Legend in Horizontal way
Hello Friends/Forum,
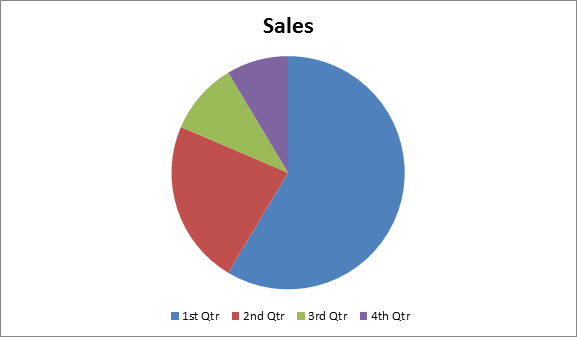
I want the Pie Chart & Legend should be in Horizontal way. For more clearty in following way.
Can anybody tell me how to achieve it?
Thanks in Advance
Shantanu
Thanks in Advance
Shantanu
- Mark as New
- Bookmark
- Subscribe
- Mute
- Subscribe to RSS Feed
- Permalink
- Report Inappropriate Content
As far as I know you can't in a pie chart. In a line chart it's almost possible. The next best thing is create a fake legend with a straight table. See attached example.
talk is cheap, supply exceeds demand
- Mark as New
- Bookmark
- Subscribe
- Mute
- Subscribe to RSS Feed
- Permalink
- Report Inappropriate Content
Hello Gysbert,
Lot of Thanks for response and showing me way out related to problem.
Gysbert I am sure u r right person to give one more solution. Following is my problem.
I had developed one report. With the help of "Edit Report". By adding the Text box by Containing word as "End Of Report" And after then in Page Setting->Setting->Appendix Placement-Last Paper and Appendx Height = 3 %
On generation of PDF for the same it give 3 pages report.
But problem is that word "End of Report" is get printed at the end of the page of Last/3rd Page. Pls see the attachment which not as per my requirment.
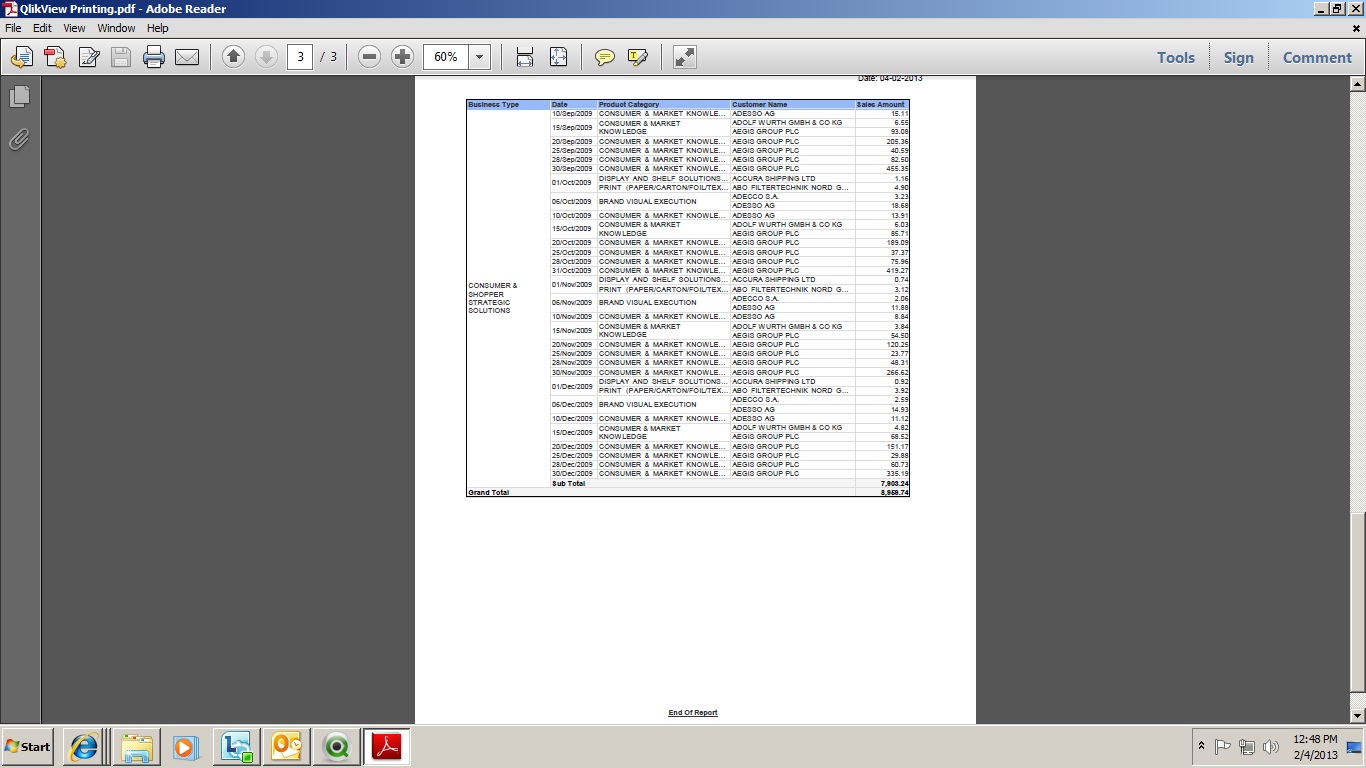
My requirment is as soon as the Report End frome there after 1st or 2nd or 3rd line the word "End of Report" should get printed in Last page.
I hope I had able to explain the scenario.
I had struk here. It will be great help if u can show some way out for generation of PDF by using "Edit Report" of QV.
Thanks in Advance
Shantanu
- Mark as New
- Bookmark
- Subscribe
- Mute
- Subscribe to RSS Feed
- Permalink
- Report Inappropriate Content
Hi Gysbert
In Line chart also is i am not able to get in horizontally my version of qlikview is 11.00.11282.0 SR1 which version are u using.
thanks
- Mark as New
- Bookmark
- Subscribe
- Mute
- Subscribe to RSS Feed
- Permalink
- Report Inappropriate Content
Gysbert Wassenaar how do you define the colors in your fake legend? In another words how do you assign the color from the legend to the chart, i'am asking this because i'am using a pie chart and i only display the largest 4 values and "others"
- Mark as New
- Bookmark
- Subscribe
- Mute
- Subscribe to RSS Feed
- Permalink
- Report Inappropriate Content
You can find an example in this discussion: http://community.qlik.com/message/293470#293470
talk is cheap, supply exceeds demand