Unlock a world of possibilities! Login now and discover the exclusive benefits awaiting you.
- Qlik Community
- :
- All Forums
- :
- QlikView App Dev
- :
- Re: Stock graph
- Subscribe to RSS Feed
- Mark Topic as New
- Mark Topic as Read
- Float this Topic for Current User
- Bookmark
- Subscribe
- Mute
- Printer Friendly Page
- Mark as New
- Bookmark
- Subscribe
- Mute
- Subscribe to RSS Feed
- Permalink
- Report Inappropriate Content
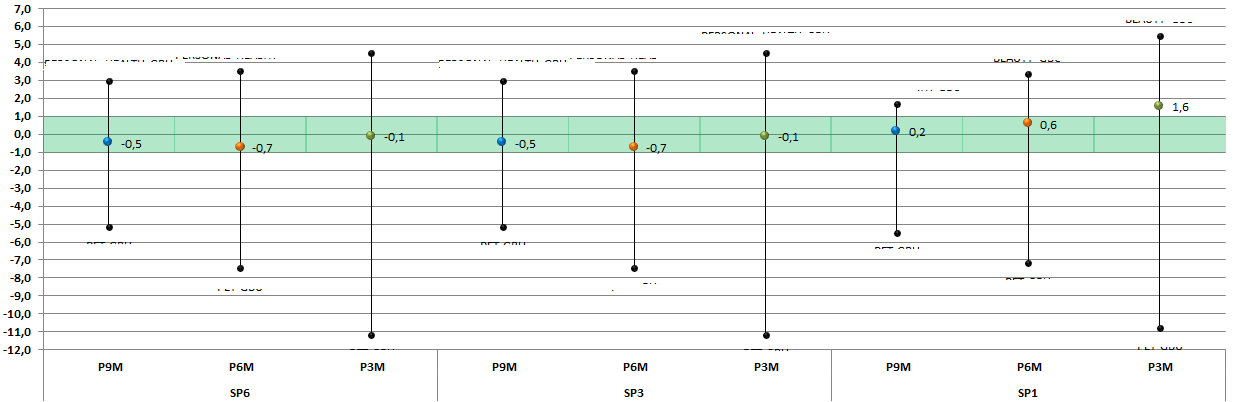
Stock graph
Hi,
I have to create exactly the same graph graph. Do you have any idea how to make it ??
- Tags:
- new_to_qlikview
- Mark as New
- Bookmark
- Subscribe
- Mute
- Subscribe to RSS Feed
- Permalink
- Report Inappropriate Content
Anna
A Box Plot may help you do something similar. But I doubt you will be able create something exactly the same.
Best Regards, Bill
- Mark as New
- Bookmark
- Subscribe
- Mute
- Subscribe to RSS Feed
- Permalink
- Report Inappropriate Content
Hi,
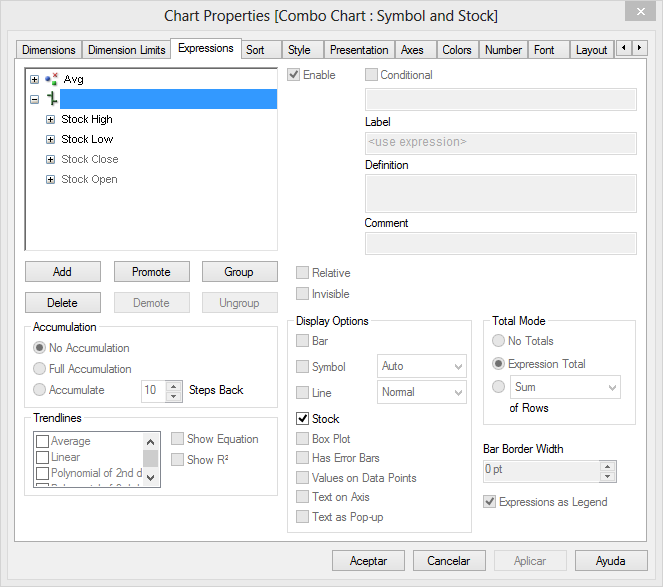
this is actually supported in QlikView. You have to create a combo chart and select the option stock in "Expressions" tab (Bar, line and/or symbol need to be de-selected in order to enable stock option). In expression options you define stock max, min, open and close depending on what you need.
Regards
- Mark as New
- Bookmark
- Subscribe
- Mute
- Subscribe to RSS Feed
- Permalink
- Report Inappropriate Content
Jaime
That sounds potentially really quite useful.
Do you know of where to find any documents or examples of this ?
Best Regards, Bill
- Mark as New
- Bookmark
- Subscribe
- Mute
- Subscribe to RSS Feed
- Permalink
- Report Inappropriate Content
There's a demo app included with QV installation called 'Data visualization'. I Think you can also download it from QlikView website. Inside document, in "Trends tab" there's an example of how Box Plots and Stock charts can be used within QlikView
Regards,
Jaime
- Mark as New
- Bookmark
- Subscribe
- Mute
- Subscribe to RSS Feed
- Permalink
- Report Inappropriate Content
Jaime
Great, found it.
Many Thanks, Bill